29
/
en
AIzaSyAYiBZKx7MnpbEhh9jyipgxe19OcubqV5w
April 1, 2024
229869
Russian Federation
RUS
true
2
1
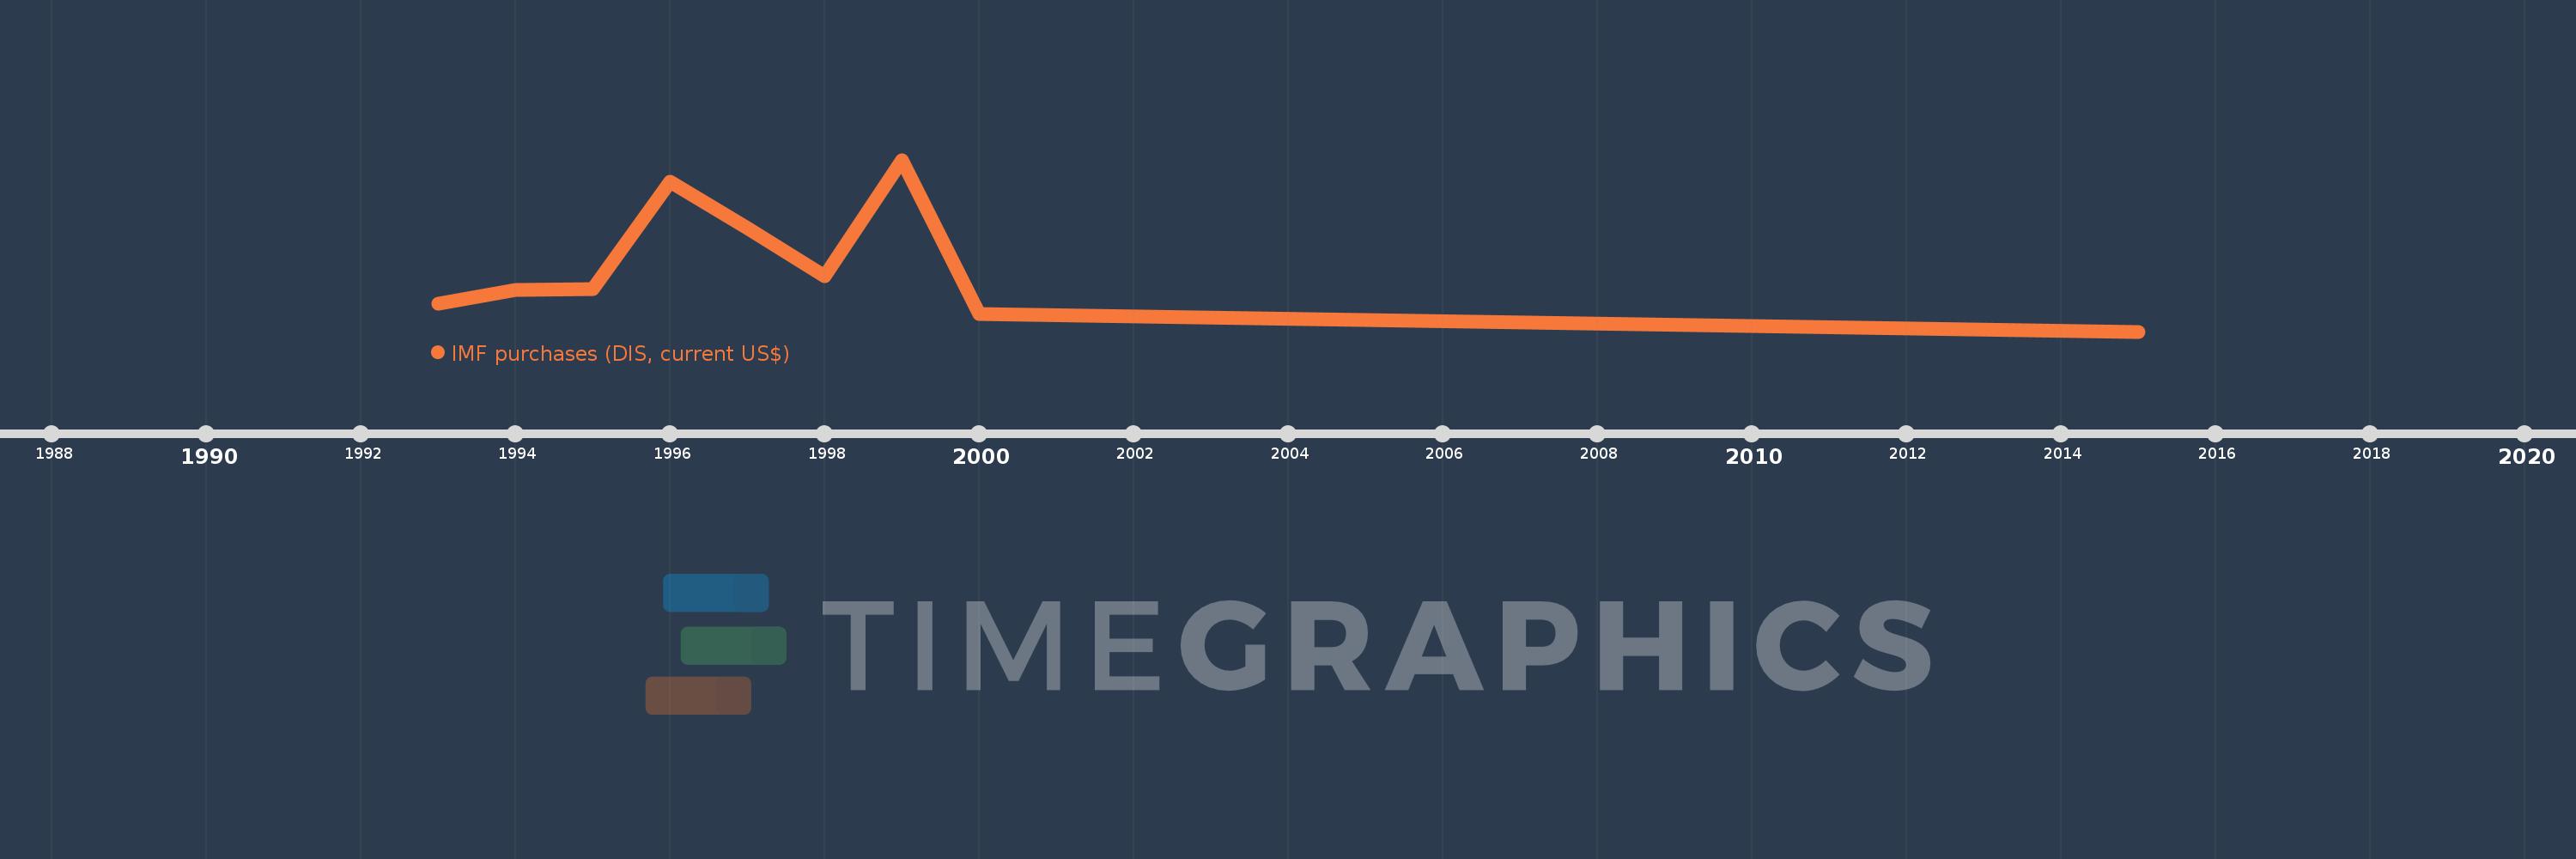
IMF purchases (DIS, current US$)
2015,2000,1999,1998,1997,1996,1995,1994,1993
This statistics in other country:
Timeline:
This timeline shows a graph from 1993 to 2015 of Russian Federation. No data until 1992. Number of actual observations by date: 9.
Source name:
World Development Indicators
Source organization:
World Bank, International Debt Statistics.
Categories, topics:
External Debt
Last updated:
apr 23, 2017
Indicators value changes by year
Maximum:
6.241 bln
jan 1, 1999
At the date of observation
Value
Absolute change
Change from previous value
jan 1, 1993
1.013 bln
+1.013 bln
0.0%
jan 1, 1994
1.506 bln
+492.903 mln
48.67%
jan 1, 1995
1.544 bln
+38.462 mln
2.55%
jan 1, 1996
5.453 bln
+3.909 bln
253.16%
jan 1, 1997
3.757 bln
-1.696 bln
-31.11%
jan 1, 1998
2.019 bln
-1.738 bln
-46.26%
jan 1, 1999
6.241 bln
+4.222 bln
209.11%
jan 1, 2000
644.628 mln
-5.597 bln
-89.67%
jan 1, 2015
0.0
-644.628 mln
-100.0%
Ranking of countries by current statistics by years


Comments: