29
/
en
AIzaSyAYiBZKx7MnpbEhh9jyipgxe19OcubqV5w
April 1, 2024
286413
Zambia
ZMB
true
2
1
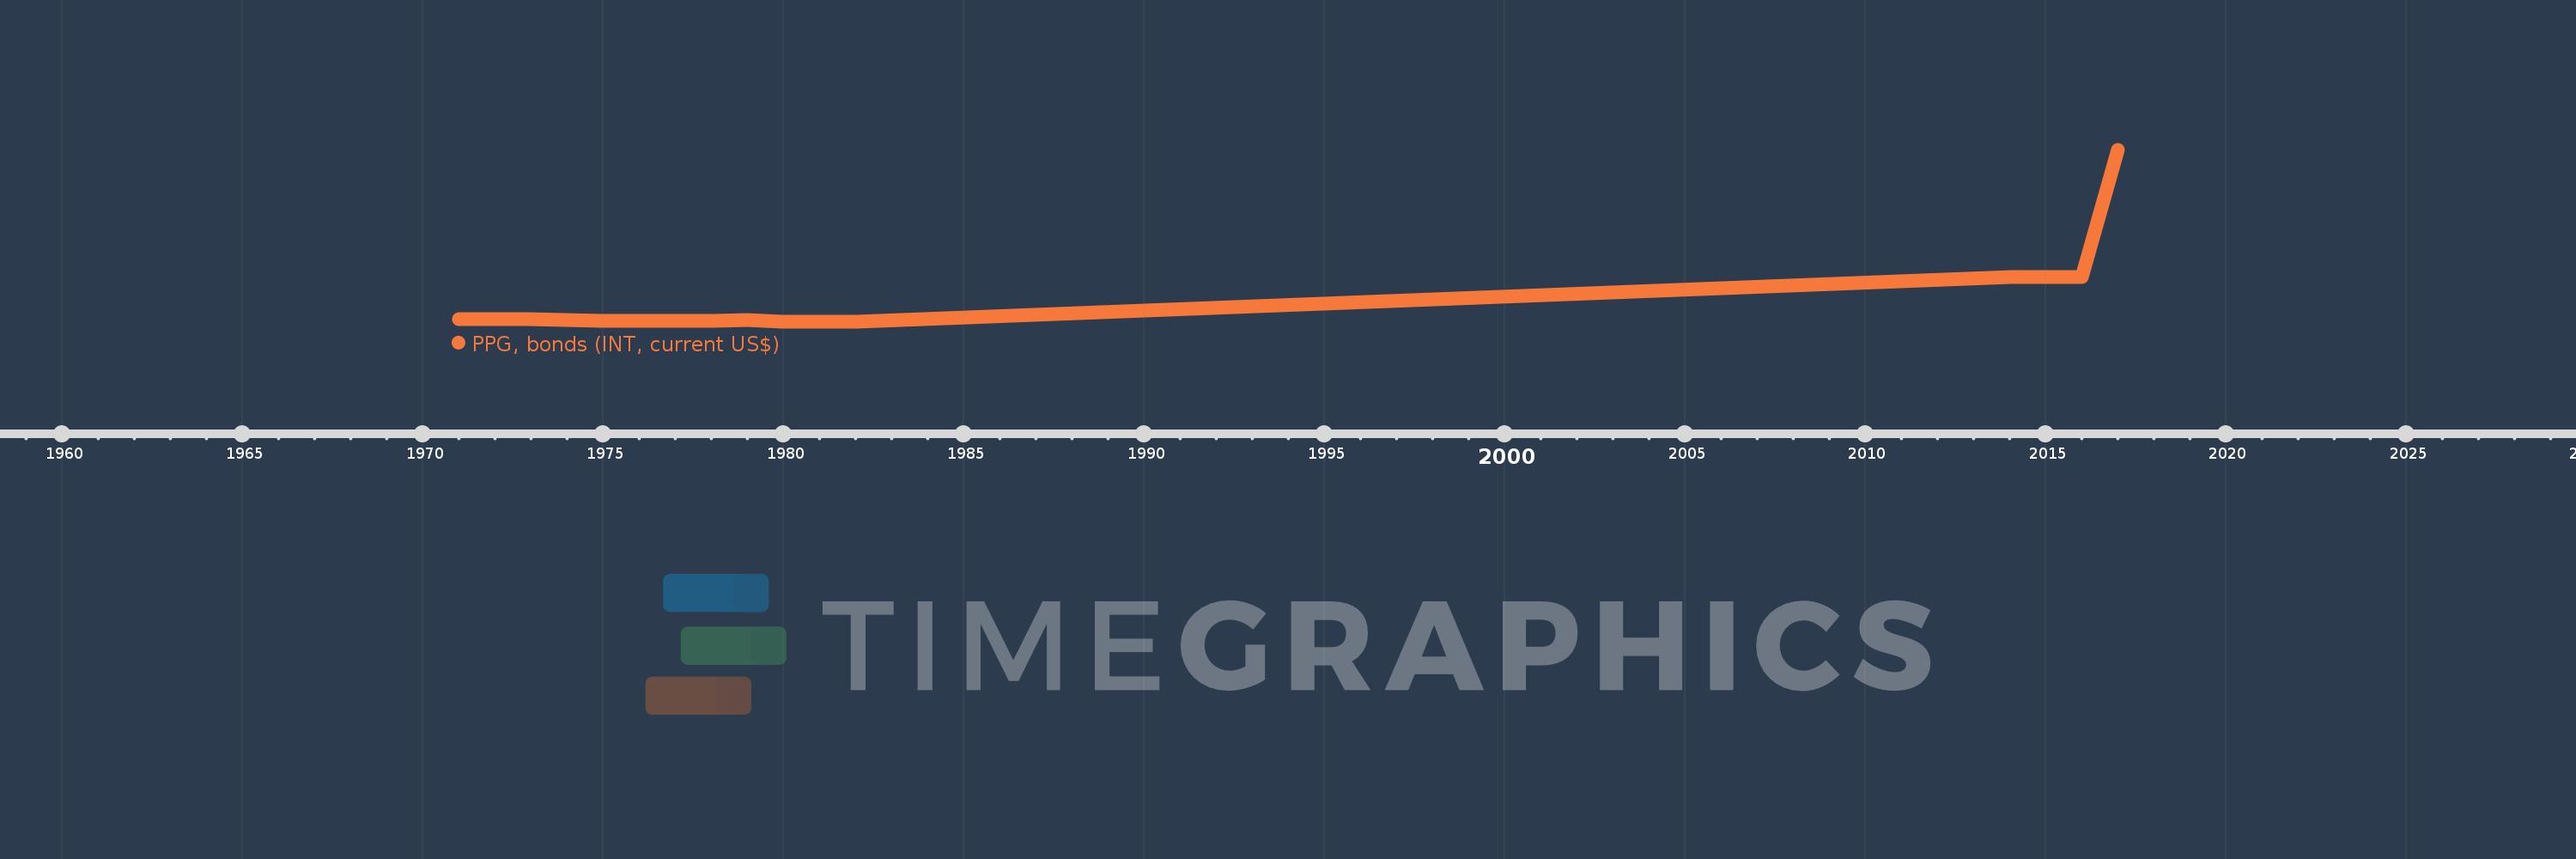
PPG, bonds (INT, current US$)
2017,2016,2015,2014,1982,1981,1980,1979,1978,1977,1976,1975,1974,1973,1972,1971
This statistics in other country:
Timeline:
This timeline shows a graph from 1971 to 2017 of Zambia. No data until 1970. Number of actual observations by date: 16.
Source name:
World Development Indicators
Source organization:
World Bank, International Debt Statistics.
Categories, topics:
External Debt
Last updated:
apr 23, 2017
Indicators value changes by year
Minimum:
499.0K
jan 1, 1982
Maximum:
152.436 mln
jan 1, 2017
At the date of observation
Value
Absolute change
Change from previous value
jan 1, 1971
3.126 mln
+3.126 mln
0.0%
jan 1, 1972
2.695 mln
-431.0K
-13.79%
jan 1, 1973
2.642 mln
-53.0K
-1.97%
jan 1, 1974
1.915 mln
-727.0K
-27.52%
jan 1, 1975
1.828 mln
-87.0K
-4.54%
jan 1, 1976
1.403 mln
-425.0K
-23.25%
jan 1, 1977
1.142 mln
-261.0K
-18.6%
jan 1, 1978
1.383 mln
+241.0K
21.1%
jan 1, 1979
1.935 mln
+552.0K
39.91%
jan 1, 1980
509.0K
-1.426 mln
-73.7%
jan 1, 1981
1.024 mln
+515.0K
101.18%
jan 1, 1982
499.0K
-525.0K
-51.27%
jan 1, 2014
40.103 mln
+39.604 mln
7.94K%
jan 1, 2015
40.312 mln
+209.0K
0.52%
jan 1, 2016
40.312 mln
0.0
0.0%
jan 1, 2017
152.436 mln
+112.124 mln
278.14%
Ranking of countries by current statistics by years


Comments: