29
/
en
AIzaSyAYiBZKx7MnpbEhh9jyipgxe19OcubqV5w
April 1, 2024
237642
Serbia
SRB
true
2
1
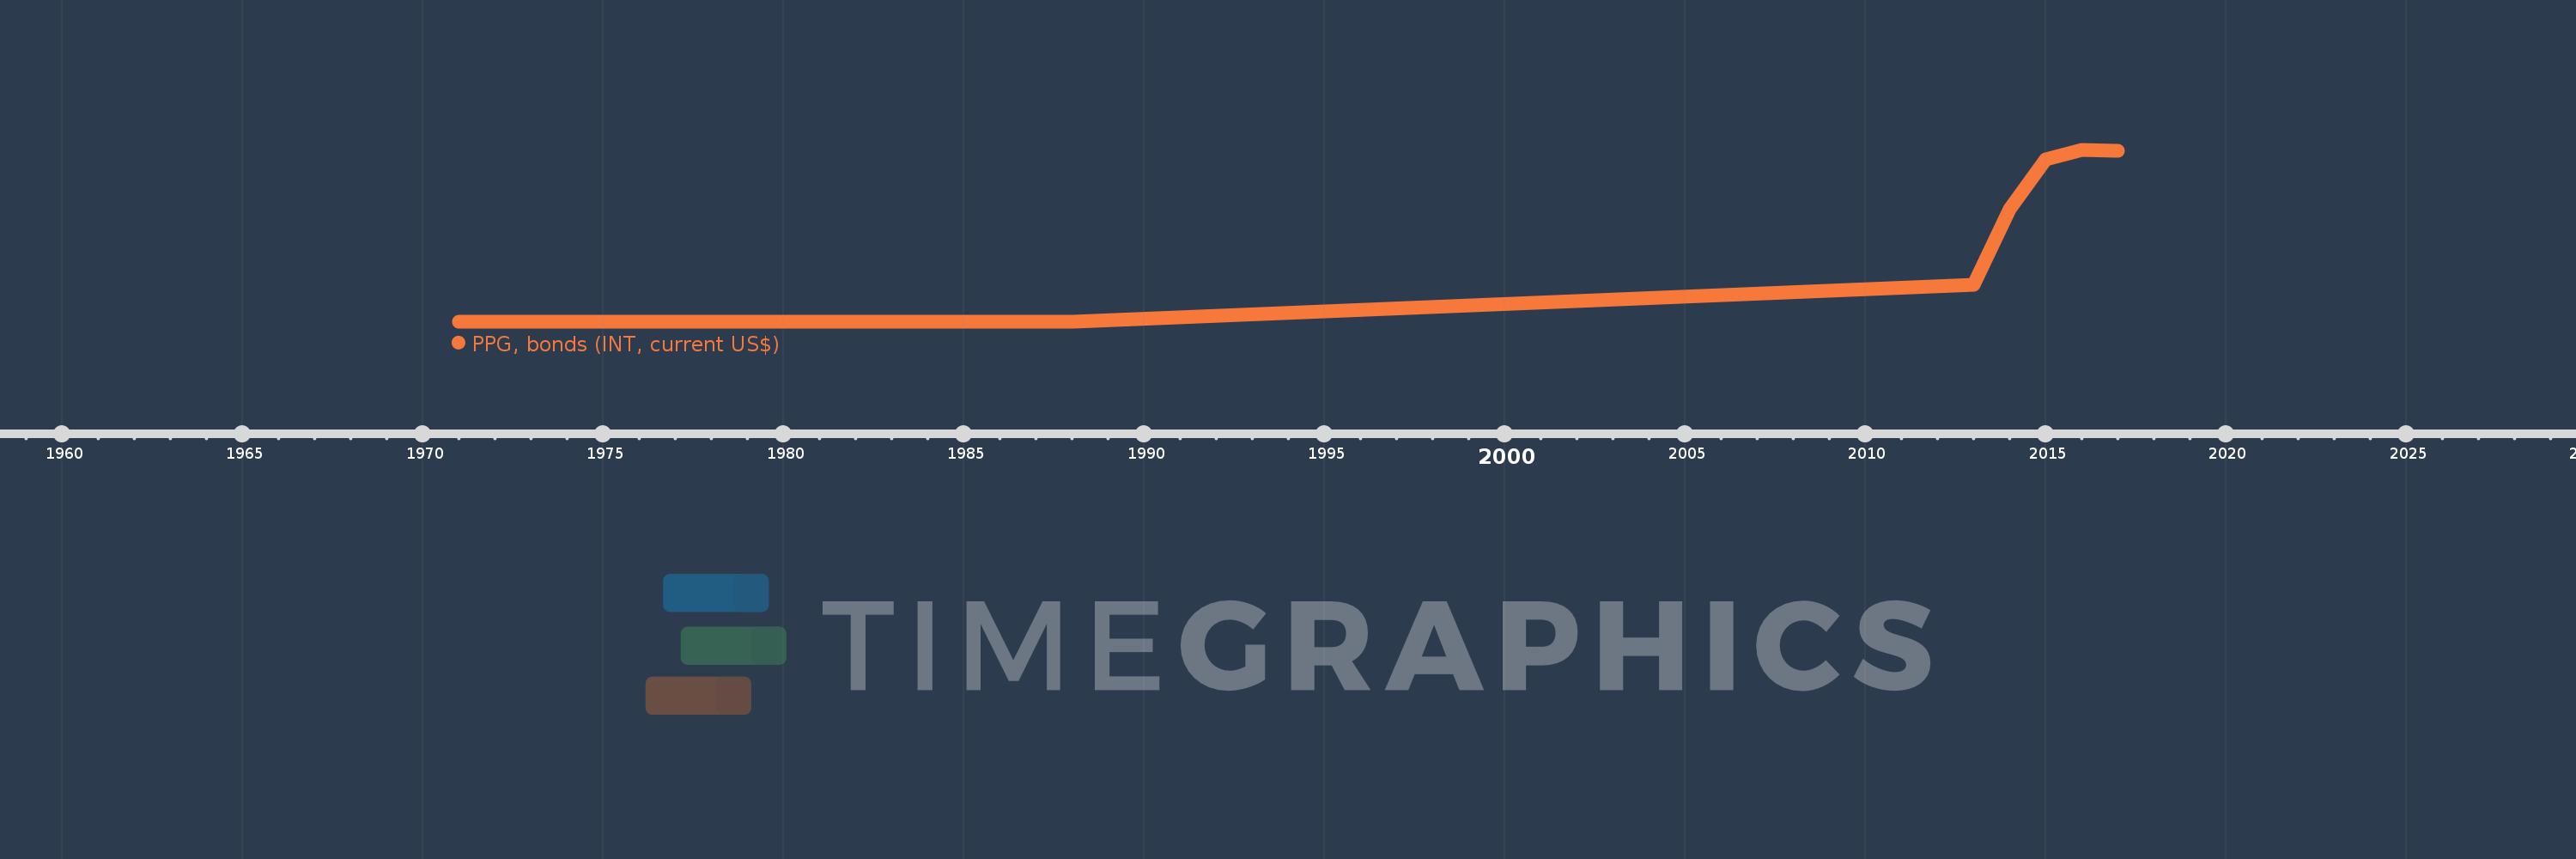
PPG, bonds (INT, current US$)
2017,2016,2015,2014,2013,1988,1987,1986,1985,1984,1983,1982,1981,1980,1979,1978,1977,1976,1975,1974,1973,1972,1971
This statistics in other country:
Timeline:
This timeline shows a graph from 1971 to 2017 of Serbia. No data until 1970. Number of actual observations by date: 23.
Source name:
World Development Indicators
Source organization:
World Bank, International Debt Statistics.
Categories, topics:
External Debt
Last updated:
apr 23, 2017
Indicators value changes by year
Maximum:
336.615 mln
jan 1, 2016
At the date of observation
Value
Absolute change
Change from previous value
jan 1, 1971
432.0K
+432.0K
0.0%
jan 1, 1972
236.0K
-196.0K
-45.37%
jan 1, 1973
382.0K
+146.0K
61.86%
jan 1, 1974
386.0K
+4.0K
1.05%
jan 1, 1975
407.0K
+21.0K
5.44%
jan 1, 1976
400.0K
-7.0K
-1.72%
jan 1, 1977
398.0K
-2.0K
-0.5%
jan 1, 1978
507.0K
+109.0K
27.39%
jan 1, 1979
498.0K
-9.0K
-1.78%
jan 1, 1980
387.0K
-111.0K
-22.29%
jan 1, 1981
309.0K
-78.0K
-20.16%
jan 1, 1982
232.0K
-77.0K
-24.92%
jan 1, 1983
187.0K
-45.0K
-19.4%
jan 1, 1984
162.0K
-25.0K
-13.37%
jan 1, 1985
119.0K
-43.0K
-26.54%
jan 1, 1986
85.0K
-34.0K
-28.57%
jan 1, 1987
51.0K
-34.0K
-40.0%
jan 1, 1988
16.0K
-35.0K
-68.63%
jan 1, 2013
72.5 mln
+72.484 mln
453.02K%
jan 1, 2014
220.938 mln
+148.438 mln
204.74%
jan 1, 2015
317.864 mln
+96.926 mln
43.87%
jan 1, 2016
336.615 mln
+18.751 mln
5.9%
jan 1, 2017
335.673 mln
-942.0K
-0.28%
Ranking of countries by current statistics by years


Comments: