29
/
en
AIzaSyAYiBZKx7MnpbEhh9jyipgxe19OcubqV5w
April 1, 2024
168029
Kenya
KEN
true
2
1
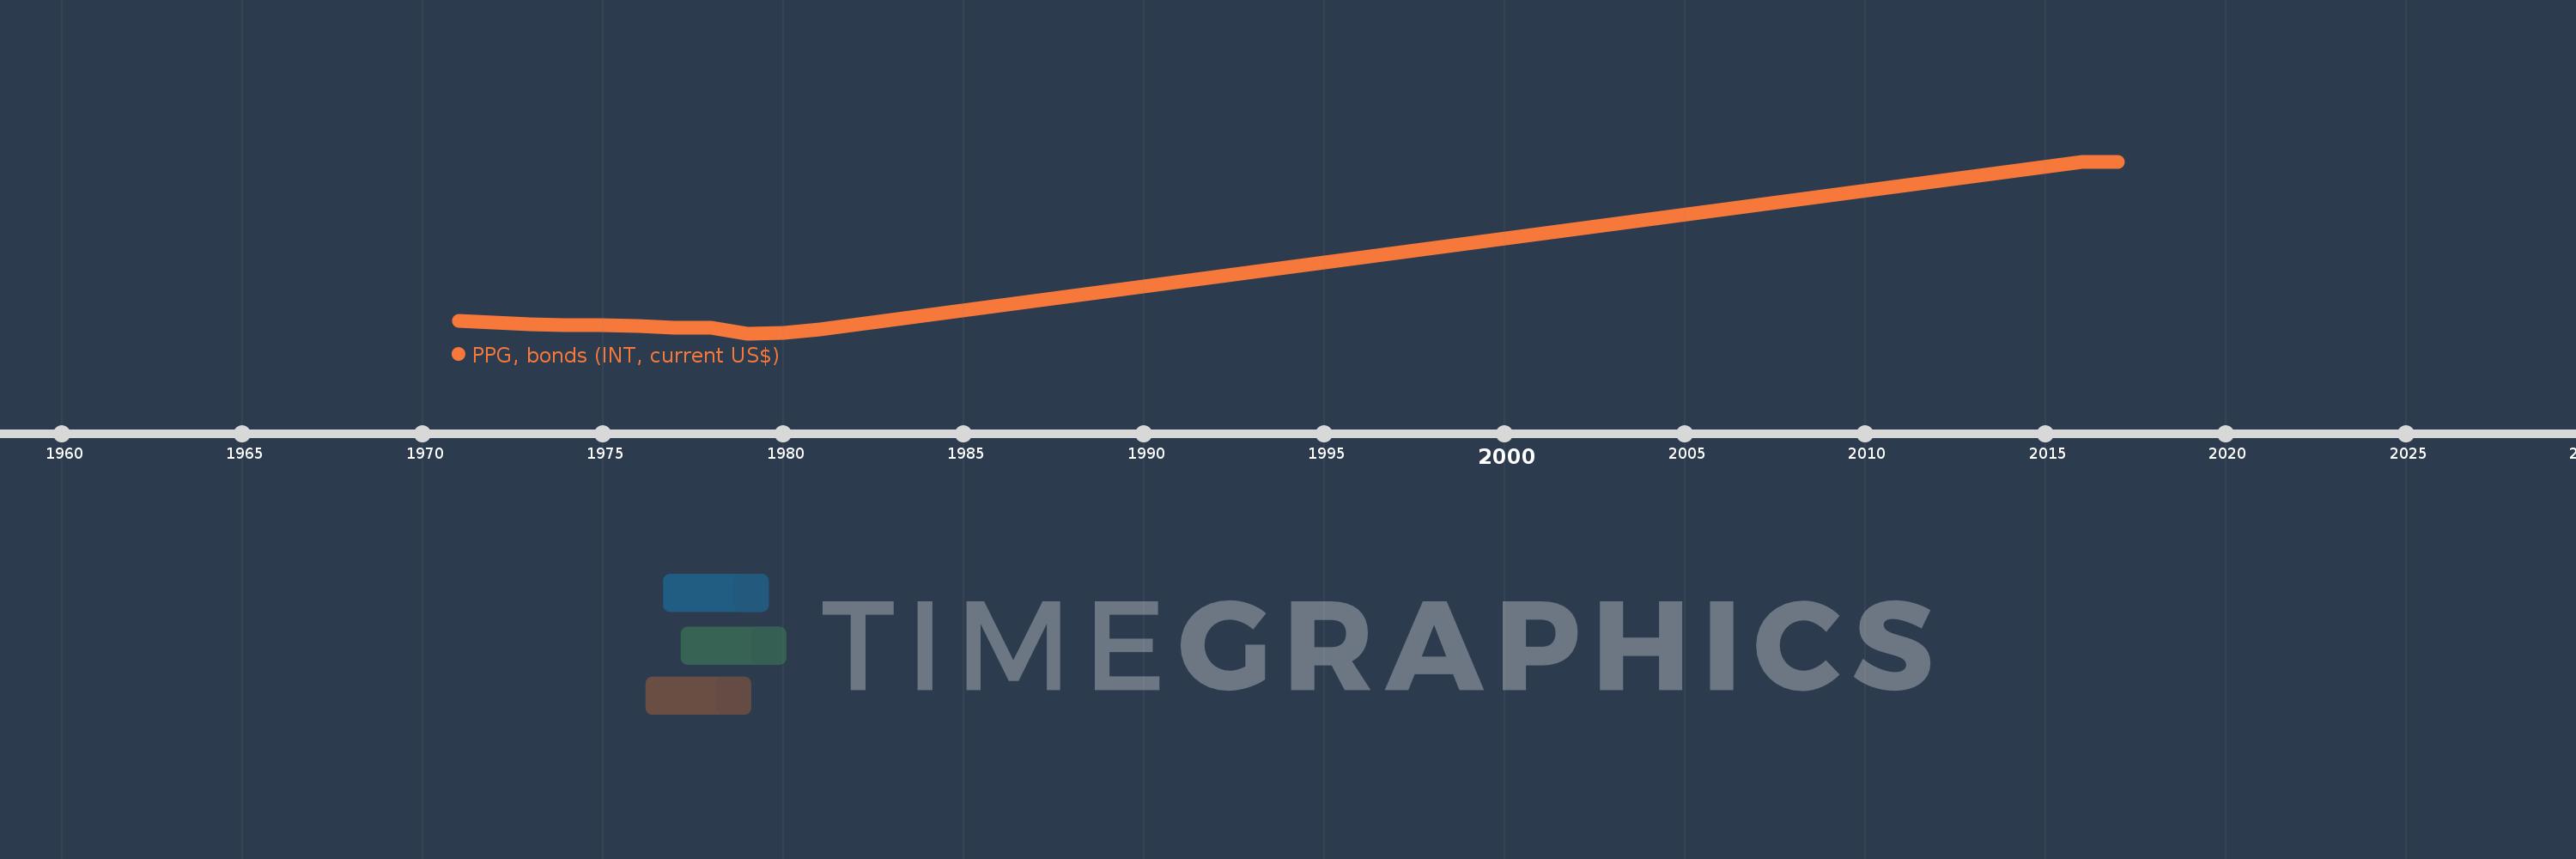
PPG, bonds (INT, current US$)
2017,2016,1981,1980,1979,1978,1977,1976,1975,1974,1973,1972,1971
This statistics in other country:
Timeline:
This timeline shows a graph from 1971 to 2017 of Kenya. No data until 1970. Number of actual observations by date: 13.
Source name:
World Development Indicators
Source organization:
World Bank, International Debt Statistics.
Categories, topics:
External Debt
Last updated:
apr 23, 2017
Indicators value changes by year
Minimum:
405.0K
jan 1, 1979
Maximum:
44.062 mln
jan 1, 2016
At the date of observation
Value
Absolute change
Change from previous value
jan 1, 1971
3.475 mln
+3.475 mln
0.0%
jan 1, 1972
3.064 mln
-411.0K
-11.83%
jan 1, 1973
2.619 mln
-445.0K
-14.52%
jan 1, 1974
2.568 mln
-51.0K
-1.95%
jan 1, 1975
2.45 mln
-118.0K
-4.6%
jan 1, 1976
2.313 mln
-137.0K
-5.59%
jan 1, 1977
1.88 mln
-433.0K
-18.72%
jan 1, 1978
1.729 mln
-151.0K
-8.03%
jan 1, 1979
405.0K
-1.324 mln
-76.58%
jan 1, 1980
448.0K
+43.0K
10.62%
jan 1, 1981
1.447 mln
+999.0K
222.99%
jan 1, 2016
44.062 mln
+42.615 mln
2.95K%
jan 1, 2017
44.062 mln
0.0
0.0%
Ranking of countries by current statistics by years


Comments: