29
/
en
AIzaSyAYiBZKx7MnpbEhh9jyipgxe19OcubqV5w
April 1, 2024
282816
Vietnam
VNM
true
2
1
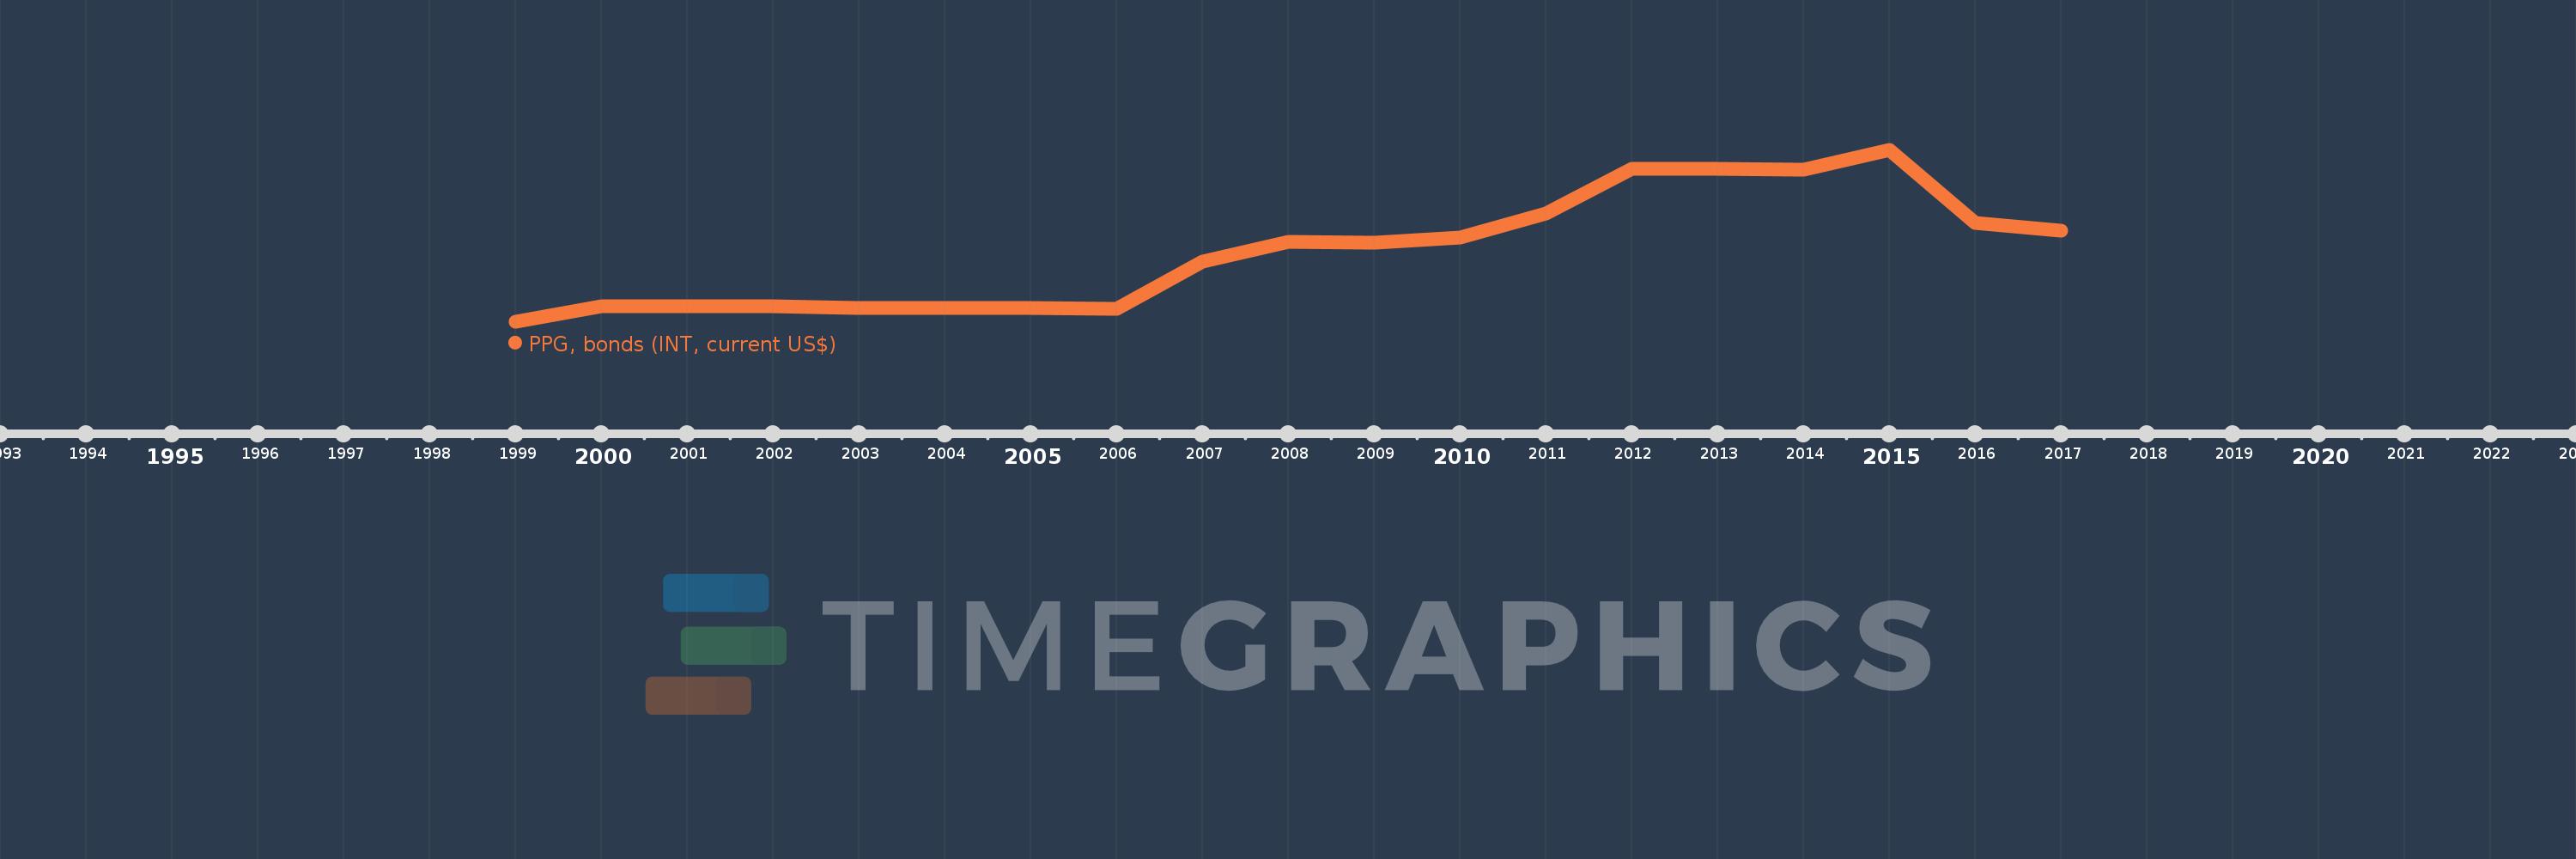
PPG, bonds (INT, current US$)
2017,2016,2015,2014,2013,2012,2011,2010,2009,2008,2007,2006,2005,2004,2003,2002,2001,2000,1999
This statistics in other country:
Timeline:
This timeline shows a graph from 1999 to 2017 of Vietnam. No data until 1998. Number of actual observations by date: 19.
Source name:
World Development Indicators
Source organization:
World Bank, International Debt Statistics.
Categories, topics:
External Debt
Last updated:
apr 23, 2017
Indicators value changes by year
Minimum:
11.551 mln
jan 1, 1999
Maximum:
140.294 mln
jan 1, 2015
At the date of observation
Value
Absolute change
Change from previous value
jan 1, 1999
11.551 mln
+11.551 mln
0.0%
jan 1, 2000
23.018 mln
+11.467 mln
99.27%
jan 1, 2001
23.136 mln
+118.0K
0.51%
jan 1, 2002
23.156 mln
+20.0K
0.09%
jan 1, 2003
22.066 mln
-1.09 mln
-4.71%
jan 1, 2004
21.91 mln
-156.0K
-0.71%
jan 1, 2005
21.87 mln
-40.0K
-0.18%
jan 1, 2006
21.503 mln
-367.0K
-1.68%
jan 1, 2007
57.065 mln
+35.562 mln
165.38%
jan 1, 2008
71.87 mln
+14.805 mln
25.94%
jan 1, 2009
70.645 mln
-1.225 mln
-1.7%
jan 1, 2010
74.713 mln
+4.068 mln
5.76%
jan 1, 2011
93.01 mln
+18.297 mln
24.49%
jan 1, 2012
126.382 mln
+33.372 mln
35.88%
jan 1, 2013
126.194 mln
-188.0K
-0.15%
jan 1, 2014
125.862 mln
-332.0K
-0.26%
jan 1, 2015
140.294 mln
+14.432 mln
11.47%
jan 1, 2016
86.045 mln
-54.249 mln
-38.67%
jan 1, 2017
79.659 mln
-6.386 mln
-7.42%
Ranking of countries by current statistics by years


Comments: