29
/
en
AIzaSyAYiBZKx7MnpbEhh9jyipgxe19OcubqV5w
April 1, 2024
283832
West Bank and Gaza
PSE
true
2
1
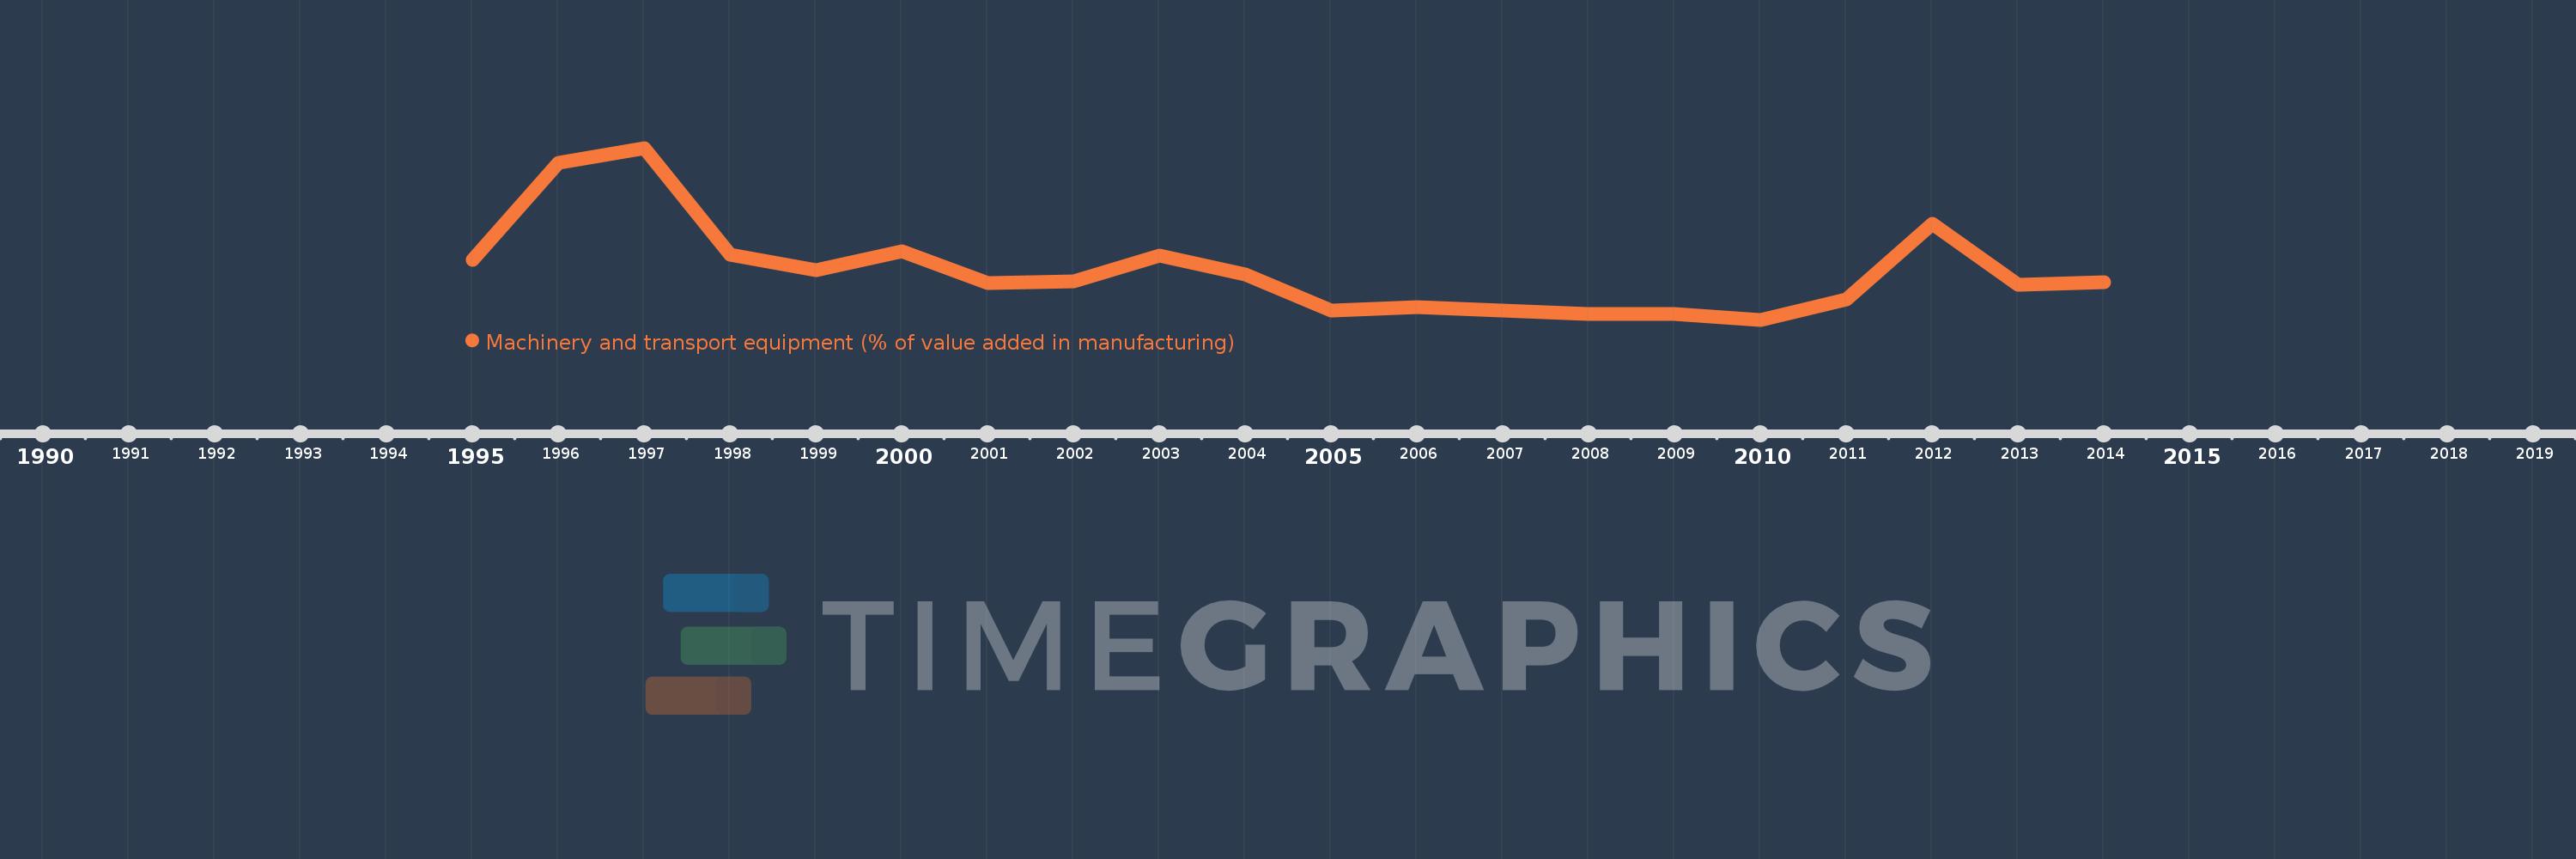
Machinery and transport equipment (% of value added in manufacturing)
2014,2013,2012,2011,2010,2009,2008,2007,2006,2005,2004,2003,2002,2001,2000,1999,1998,1997,1996,1995
This statistics in other country:
AlbaniaAlgeriaArgentinaAustraliaAustriaAzerbaijanBahamas, TheBahrainBangladeshBarbadosBelarusBelgiumBelizeBeninBoliviaBosnia and HerzegovinaBotswanaBrazilBulgariaBurkina FasoBurundiCambodiaCameroonCanadaCentral African RepublicChileChinaColombiaCongo, Rep.Costa RicaCote d'IvoireCroatiaCubaCyprusCzech RepublicDenmarkDominican RepublicEcuadorEgypt, Arab Rep.El SalvadorEritreaEstoniaEthiopiaFijiFinlandFranceGabonGambia, TheGeorgiaGermanyGhanaGreeceGuatemalaHondurasHong Kong SAR, ChinaHungaryIcelandIndiaIndonesiaIran, Islamic Rep.IraqIrelandIsraelItalyJamaicaJapanJordanKazakhstanKenyaKorea, Rep.KuwaitKyrgyz RepublicLao PDRLatviaLebanonLibyaLithuaniaLuxembourgMacao SAR, ChinaMacedonia, FYRMadagascarMalawiMalaysiaMaltaMauritiusMexicoMoldovaMongoliaMoroccoMozambiqueNamibiaNepalNetherlandsNew ZealandNicaraguaNigeriaNorwayOmanPakistanPanamaPapua New GuineaParaguayPeruPhilippinesPolandPortugalPuerto RicoQatarRomaniaRussian FederationSaudi ArabiaSenegalSerbiaSingaporeSlovak RepublicSloveniaSomaliaSouth AfricaSpainSri LankaSt. LuciaSudanSwazilandSwedenSwitzerlandSyrian Arab RepublicTanzaniaThailandTongaTrinidad and TobagoTunisiaTurkeyUgandaUkraineUnited Arab EmiratesUnited KingdomUnited StatesUruguayVenezuela, RBVietnamWest Bank and GazaYemen, Rep.Zambia Timeline:
This timeline shows a graph from 1995 to 2014 of West Bank and Gaza. No data until 1994. Number of actual observations by date: 20.
Source name:
World Development Indicators
Source organization:
United Nations Industrial Development Organization, International Yearbook of Industrial Statistics.
Categories, topics:
Economy & Growth
Last updated:
apr 23, 2017
Indicators value changes by year
At the date of observation
Value
Absolute change
Change from previous value
jan 1, 1995
1.775
+1.775
0.0%
jan 1, 1996
3.395
+1.621
91.31%
jan 1, 1997
3.644
+0.248
7.31%
jan 1, 1998
1.85
-1.794
-49.23%
jan 1, 1999
1.598
-0.252
-13.63%
jan 1, 2000
1.917
+0.32
20.0%
jan 1, 2001
1.386
-0.531
-27.7%
jan 1, 2002
1.409
+0.023
1.68%
jan 1, 2003
1.84
+0.43
30.51%
jan 1, 2004
1.527
-0.313
-17.0%
jan 1, 2005
0.913
-0.614
-40.2%
jan 1, 2006
0.98
+0.067
7.38%
jan 1, 2007
0.917
-0.063
-6.45%
jan 1, 2008
0.857
-0.06
-6.51%
jan 1, 2009
0.861
+0.004
0.46%
jan 1, 2010
0.765
-0.097
-11.22%
jan 1, 2011
1.111
+0.347
45.32%
jan 1, 2012
2.379
+1.268
114.07%
jan 1, 2013
1.353
-1.026
-43.12%
jan 1, 2014
1.395
+0.042
3.1%
Ranking of countries by current statistics by years


Comments: