29
/
en
AIzaSyAYiBZKx7MnpbEhh9jyipgxe19OcubqV5w
April 1, 2024
144642
Guatemala
GTM
true
2
1
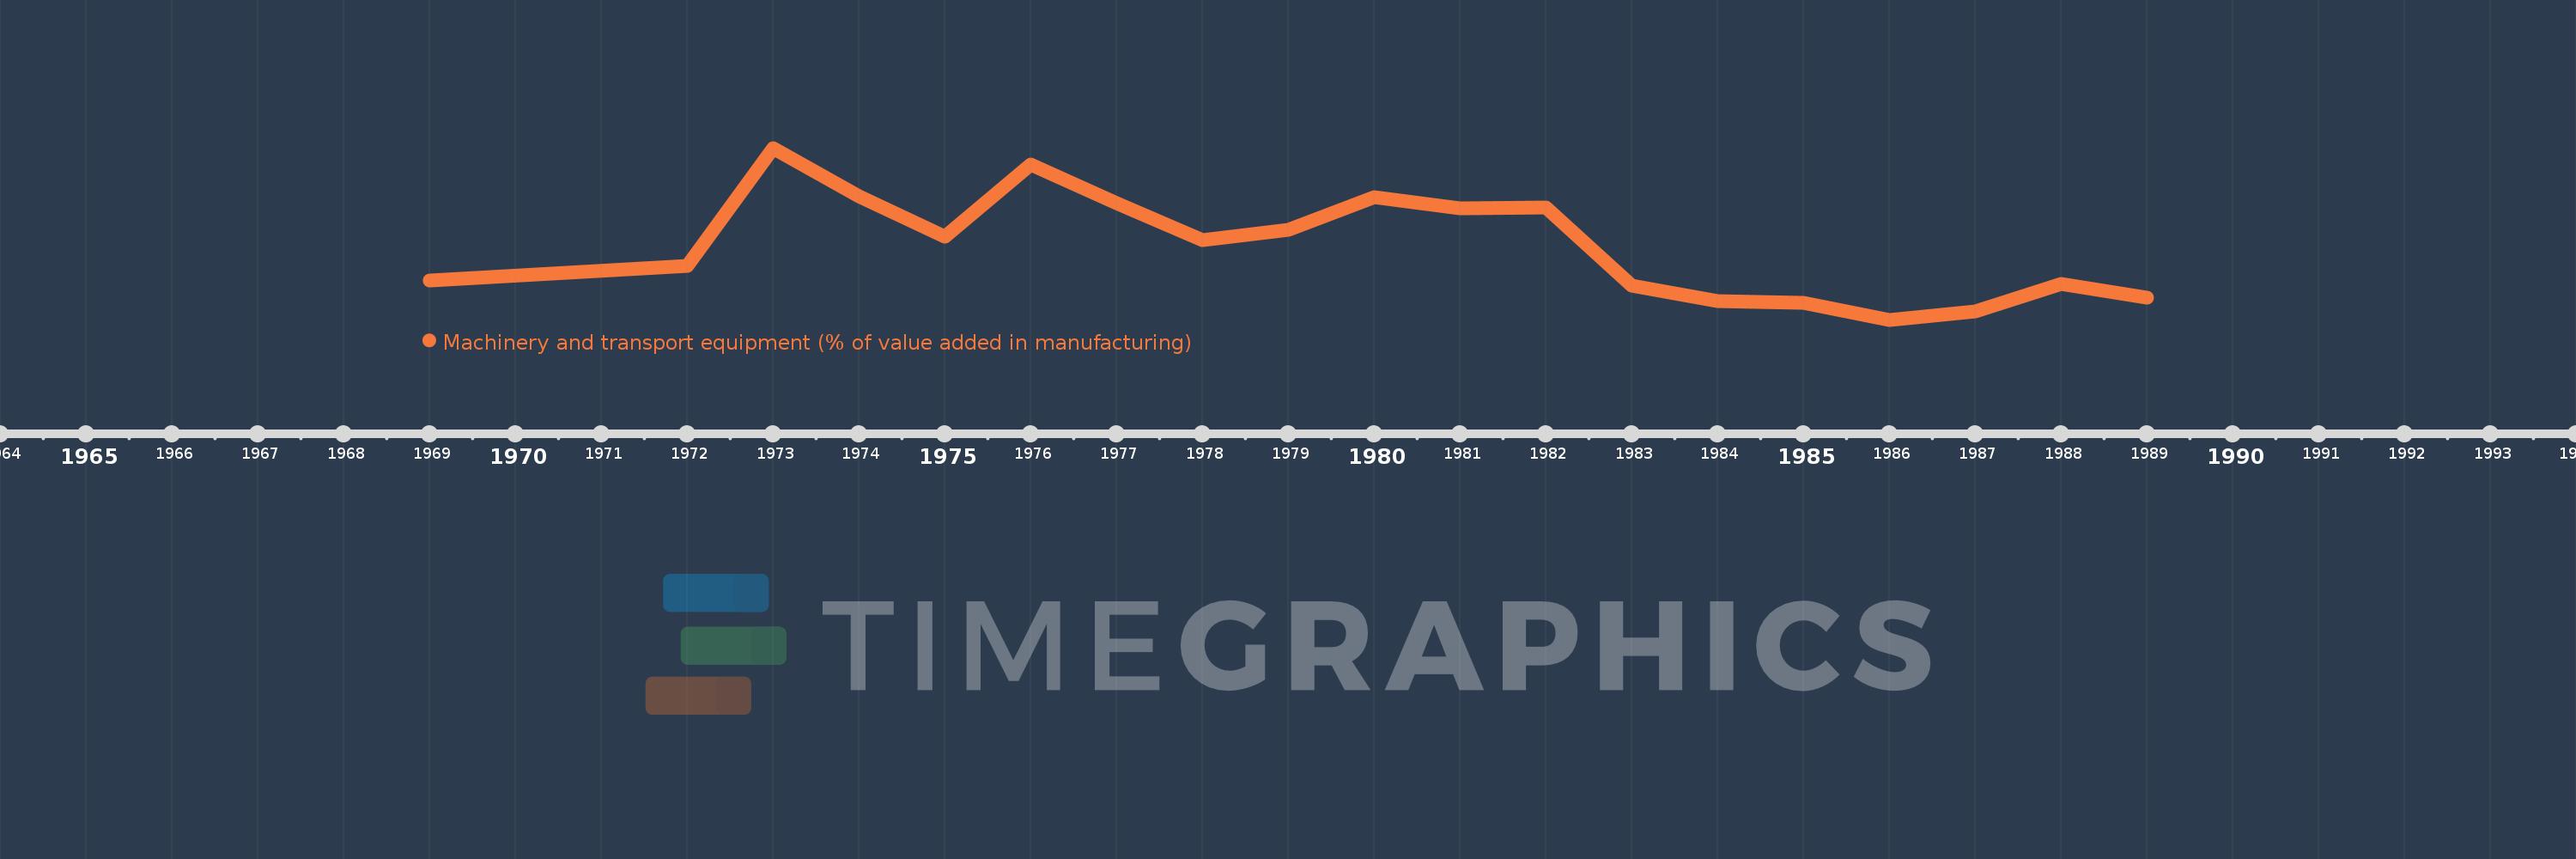
Machinery and transport equipment (% of value added in manufacturing)
1989,1988,1987,1986,1985,1984,1983,1982,1981,1980,1979,1978,1977,1976,1975,1974,1973,1972,1969
This statistics in other country:
AlbaniaAlgeriaArgentinaAustraliaAustriaAzerbaijanBahamas, TheBahrainBangladeshBarbadosBelarusBelgiumBelizeBeninBoliviaBosnia and HerzegovinaBotswanaBrazilBulgariaBurkina FasoBurundiCambodiaCameroonCanadaCentral African RepublicChileChinaColombiaCongo, Rep.Costa RicaCote d'IvoireCroatiaCubaCyprusCzech RepublicDenmarkDominican RepublicEcuadorEgypt, Arab Rep.El SalvadorEritreaEstoniaEthiopiaFijiFinlandFranceGabonGambia, TheGeorgiaGermanyGhanaGreeceGuatemalaHondurasHong Kong SAR, ChinaHungaryIcelandIndiaIndonesiaIran, Islamic Rep.IraqIrelandIsraelItalyJamaicaJapanJordanKazakhstanKenyaKorea, Rep.KuwaitKyrgyz RepublicLao PDRLatviaLebanonLibyaLithuaniaLuxembourgMacao SAR, ChinaMacedonia, FYRMadagascarMalawiMalaysiaMaltaMauritiusMexicoMoldovaMongoliaMoroccoMozambiqueNamibiaNepalNetherlandsNew ZealandNicaraguaNigeriaNorwayOmanPakistanPanamaPapua New GuineaParaguayPeruPhilippinesPolandPortugalPuerto RicoQatarRomaniaRussian FederationSaudi ArabiaSenegalSerbiaSingaporeSlovak RepublicSloveniaSomaliaSouth AfricaSpainSri LankaSt. LuciaSudanSwazilandSwedenSwitzerlandSyrian Arab RepublicTanzaniaThailandTongaTrinidad and TobagoTunisiaTurkeyUgandaUkraineUnited Arab EmiratesUnited KingdomUnited StatesUruguayVenezuela, RBVietnamWest Bank and GazaYemen, Rep.Zambia Timeline:
This timeline shows a graph from 1969 to 1989 of Guatemala. No data until 1968. Number of actual observations by date: 19.
Source name:
World Development Indicators
Source organization:
United Nations Industrial Development Organization, International Yearbook of Industrial Statistics.
Categories, topics:
Economy & Growth
Last updated:
apr 23, 2017
Indicators value changes by year
At the date of observation
Value
Absolute change
Change from previous value
jan 1, 1969
1.252
+1.252
0.0%
jan 1, 1972
1.358
+0.106
8.47%
jan 1, 1973
2.19
+0.832
61.27%
jan 1, 1974
1.849
-0.341
-15.58%
jan 1, 1975
1.561
-0.288
-15.58%
jan 1, 1976
2.074
+0.513
32.87%
jan 1, 1977
1.8
-0.274
-13.21%
jan 1, 1978
1.541
-0.259
-14.38%
jan 1, 1979
1.615
+0.074
4.77%
jan 1, 1980
1.845
+0.23
14.28%
jan 1, 1981
1.763
-0.082
-4.47%
jan 1, 1982
1.772
+0.009
0.53%
jan 1, 1983
1.218
-0.554
-31.24%
jan 1, 1984
1.112
-0.106
-8.72%
jan 1, 1985
1.1
-0.012
-1.12%
jan 1, 1986
0.978
-0.121
-11.03%
jan 1, 1987
1.039
+0.06
6.16%
jan 1, 1988
1.231
+0.193
18.55%
jan 1, 1989
1.133
-0.098
-7.97%
Ranking of countries by current statistics by years


Comments: