29
/
en
AIzaSyAYiBZKx7MnpbEhh9jyipgxe19OcubqV5w
April 1, 2024
115043
Croatia
HRV
true
2
1
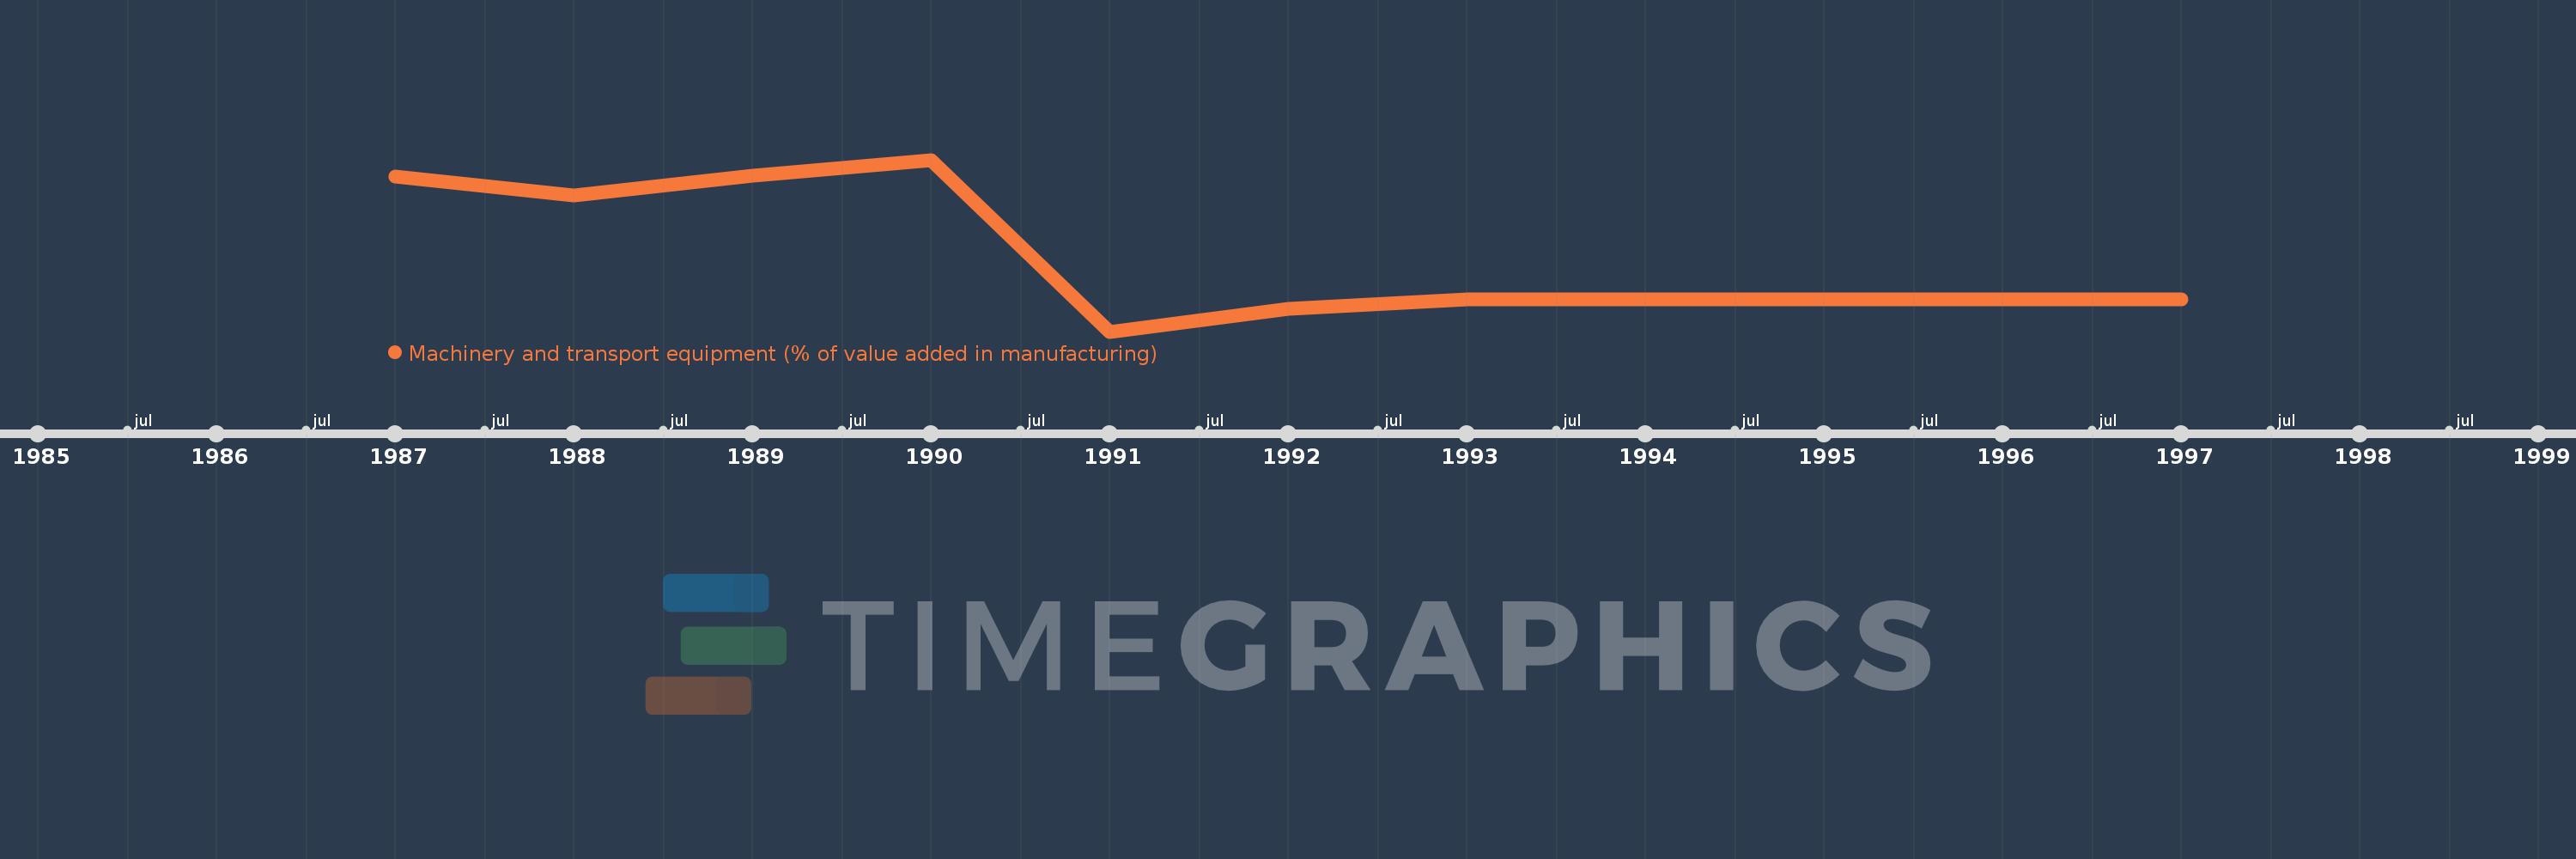
Machinery and transport equipment (% of value added in manufacturing)
1997,1996,1995,1994,1993,1992,1991,1990,1989,1988,1987
This statistics in other country:
AlbaniaAlgeriaArgentinaAustraliaAustriaAzerbaijanBahamas, TheBahrainBangladeshBarbadosBelarusBelgiumBelizeBeninBoliviaBosnia and HerzegovinaBotswanaBrazilBulgariaBurkina FasoBurundiCambodiaCameroonCanadaCentral African RepublicChileChinaColombiaCongo, Rep.Costa RicaCote d'IvoireCroatiaCubaCyprusCzech RepublicDenmarkDominican RepublicEcuadorEgypt, Arab Rep.El SalvadorEritreaEstoniaEthiopiaFijiFinlandFranceGabonGambia, TheGeorgiaGermanyGhanaGreeceGuatemalaHondurasHong Kong SAR, ChinaHungaryIcelandIndiaIndonesiaIran, Islamic Rep.IraqIrelandIsraelItalyJamaicaJapanJordanKazakhstanKenyaKorea, Rep.KuwaitKyrgyz RepublicLao PDRLatviaLebanonLibyaLithuaniaLuxembourgMacao SAR, ChinaMacedonia, FYRMadagascarMalawiMalaysiaMaltaMauritiusMexicoMoldovaMongoliaMoroccoMozambiqueNamibiaNepalNetherlandsNew ZealandNicaraguaNigeriaNorwayOmanPakistanPanamaPapua New GuineaParaguayPeruPhilippinesPolandPortugalPuerto RicoQatarRomaniaRussian FederationSaudi ArabiaSenegalSerbiaSingaporeSlovak RepublicSloveniaSomaliaSouth AfricaSpainSri LankaSt. LuciaSudanSwazilandSwedenSwitzerlandSyrian Arab RepublicTanzaniaThailandTongaTrinidad and TobagoTunisiaTurkeyUgandaUkraineUnited Arab EmiratesUnited KingdomUnited StatesUruguayVenezuela, RBVietnamWest Bank and GazaYemen, Rep.Zambia Timeline:
This timeline shows a graph from 1987 to 1997 of Croatia. No data until 1986. Number of actual observations by date: 11.
Source name:
World Development Indicators
Source organization:
United Nations Industrial Development Organization, International Yearbook of Industrial Statistics.
Categories, topics:
Economy & Growth
Last updated:
apr 23, 2017
Indicators value changes by year
Minimum:
12.518
jan 1, 1991
Maximum:
19.076
jan 1, 1990
At the date of observation
Value
Absolute change
Change from previous value
jan 1, 1987
18.442
+18.442
0.0%
jan 1, 1988
17.708
-0.734
-3.98%
jan 1, 1989
18.461
+0.753
4.25%
jan 1, 1990
19.076
+0.614
3.33%
jan 1, 1991
12.518
-6.557
-34.38%
jan 1, 1992
13.382
+0.864
6.9%
jan 1, 1993
13.756
+0.374
2.8%
jan 1, 1994
13.756
+0.0
0.0%
jan 1, 1995
13.756
0.0
0.0%
jan 1, 1996
13.756
0.0
0.0%
jan 1, 1997
13.756
0.0
0.0%
Ranking of countries by current statistics by years


Comments: