29
/
en
AIzaSyAYiBZKx7MnpbEhh9jyipgxe19OcubqV5w
April 1, 2024
258560
Syrian Arab Republic
SYR
true
2
1
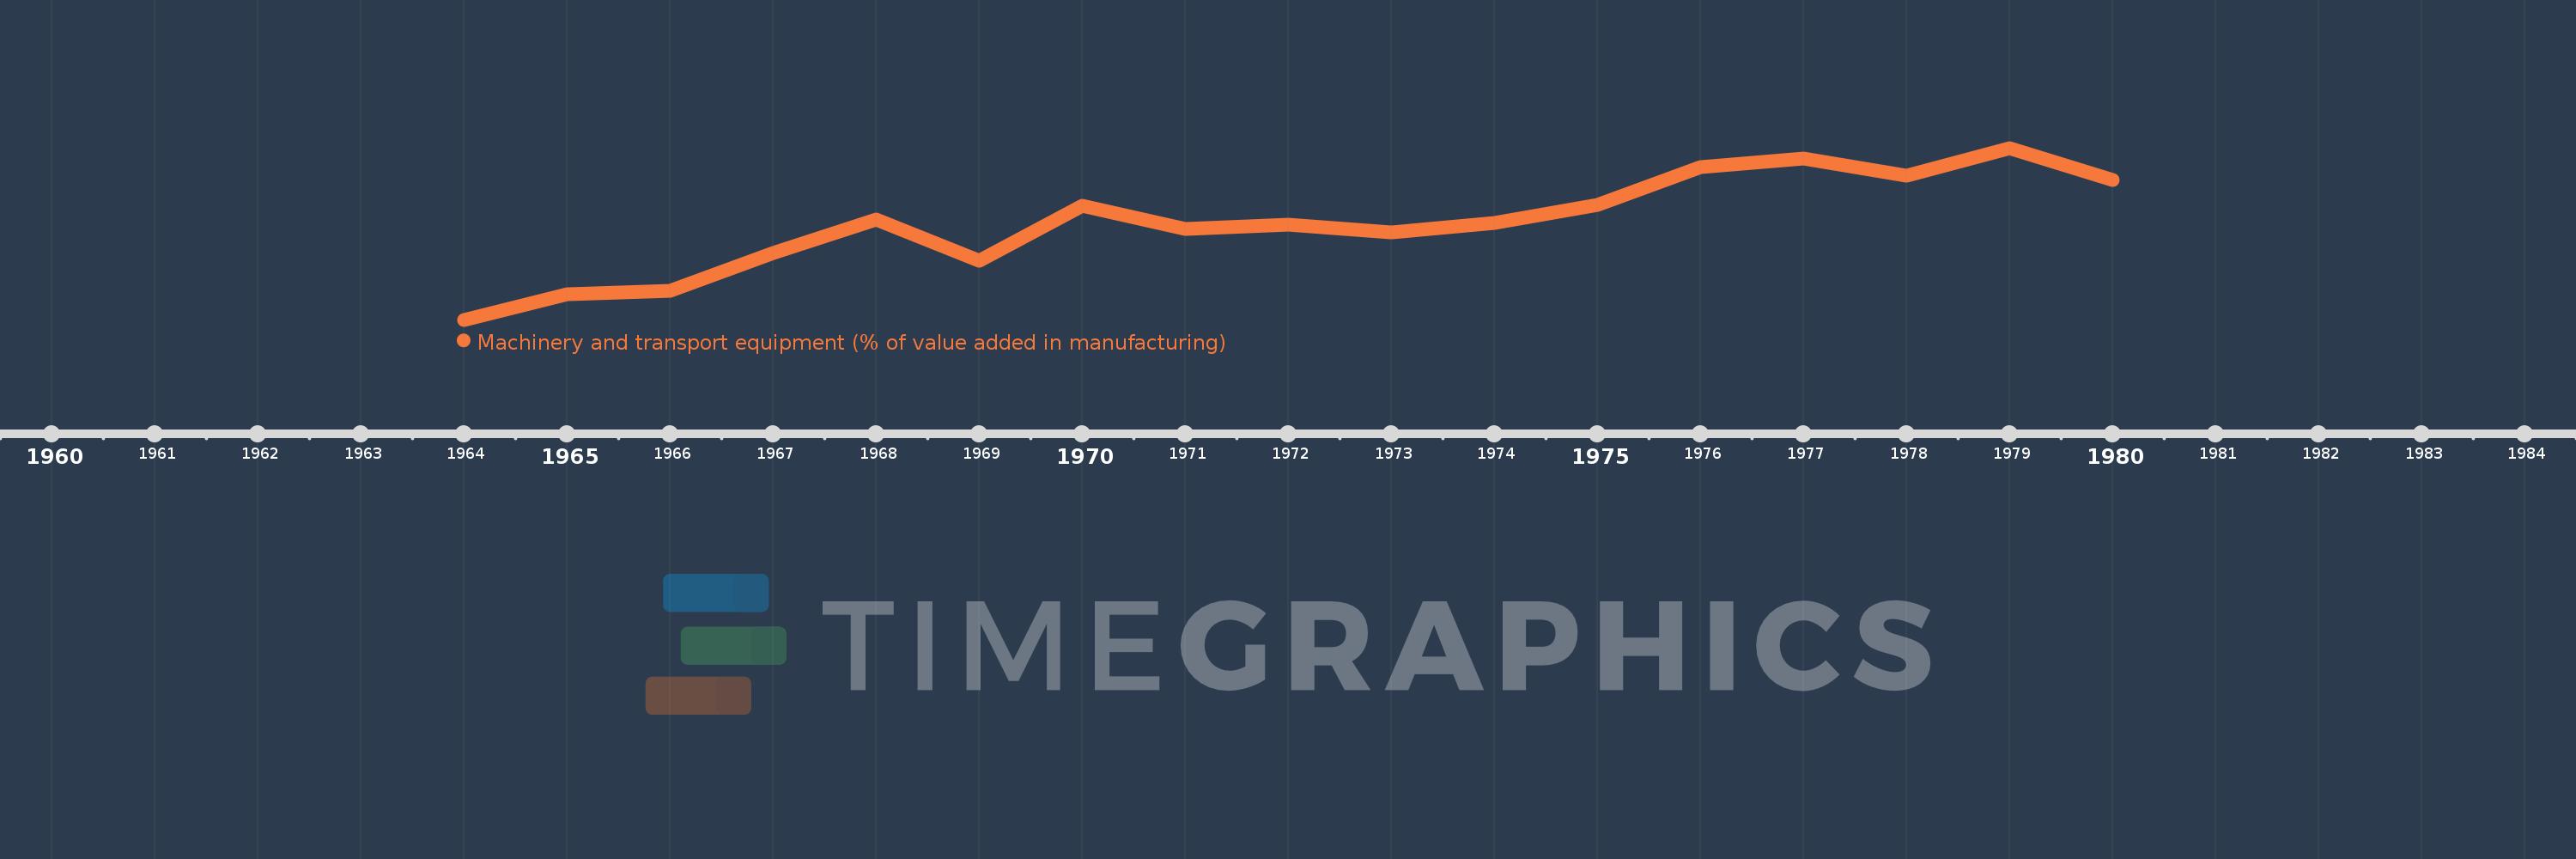
Machinery and transport equipment (% of value added in manufacturing)
1980,1979,1978,1977,1976,1975,1974,1973,1972,1971,1970,1969,1968,1967,1966,1965,1964
This statistics in other country:
AlbaniaAlgeriaArgentinaAustraliaAustriaAzerbaijanBahamas, TheBahrainBangladeshBarbadosBelarusBelgiumBelizeBeninBoliviaBosnia and HerzegovinaBotswanaBrazilBulgariaBurkina FasoBurundiCambodiaCameroonCanadaCentral African RepublicChileChinaColombiaCongo, Rep.Costa RicaCote d'IvoireCroatiaCubaCyprusCzech RepublicDenmarkDominican RepublicEcuadorEgypt, Arab Rep.El SalvadorEritreaEstoniaEthiopiaFijiFinlandFranceGabonGambia, TheGeorgiaGermanyGhanaGreeceGuatemalaHondurasHong Kong SAR, ChinaHungaryIcelandIndiaIndonesiaIran, Islamic Rep.IraqIrelandIsraelItalyJamaicaJapanJordanKazakhstanKenyaKorea, Rep.KuwaitKyrgyz RepublicLao PDRLatviaLebanonLibyaLithuaniaLuxembourgMacao SAR, ChinaMacedonia, FYRMadagascarMalawiMalaysiaMaltaMauritiusMexicoMoldovaMongoliaMoroccoMozambiqueNamibiaNepalNetherlandsNew ZealandNicaraguaNigeriaNorwayOmanPakistanPanamaPapua New GuineaParaguayPeruPhilippinesPolandPortugalPuerto RicoQatarRomaniaRussian FederationSaudi ArabiaSenegalSerbiaSingaporeSlovak RepublicSloveniaSomaliaSouth AfricaSpainSri LankaSt. LuciaSudanSwazilandSwedenSwitzerlandSyrian Arab RepublicTanzaniaThailandTongaTrinidad and TobagoTunisiaTurkeyUgandaUkraineUnited Arab EmiratesUnited KingdomUnited StatesUruguayVenezuela, RBVietnamWest Bank and GazaYemen, Rep.Zambia Timeline:
This timeline shows a graph from 1964 to 1980 of Syrian Arab Republic. No data until 1963. Number of actual observations by date: 17.
Source name:
World Development Indicators
Source organization:
United Nations Industrial Development Organization, International Yearbook of Industrial Statistics.
Categories, topics:
Economy & Growth
Last updated:
apr 23, 2017
Indicators value changes by year
At the date of observation
Value
Absolute change
Change from previous value
jan 1, 1964
0.845
+0.845
0.0%
jan 1, 1965
1.114
+0.268
31.71%
jan 1, 1966
1.147
+0.033
3.0%
jan 1, 1967
1.548
+0.401
34.94%
jan 1, 1968
1.9
+0.352
22.74%
jan 1, 1969
1.465
-0.435
-22.89%
jan 1, 1970
2.037
+0.572
39.02%
jan 1, 1971
1.794
-0.243
-11.92%
jan 1, 1972
1.846
+0.052
2.9%
jan 1, 1973
1.761
-0.085
-4.59%
jan 1, 1974
1.861
+0.1
5.65%
jan 1, 1975
2.047
+0.186
10.01%
jan 1, 1976
2.451
+0.404
19.74%
jan 1, 1977
2.541
+0.09
3.66%
jan 1, 1978
2.361
-0.18
-7.09%
jan 1, 1979
2.648
+0.287
12.17%
jan 1, 1980
2.31
-0.338
-12.78%
Ranking of countries by current statistics by years


Comments: