29
/
en
AIzaSyAYiBZKx7MnpbEhh9jyipgxe19OcubqV5w
April 1, 2024
279185
Uzbekistan
UZB
true
2
1
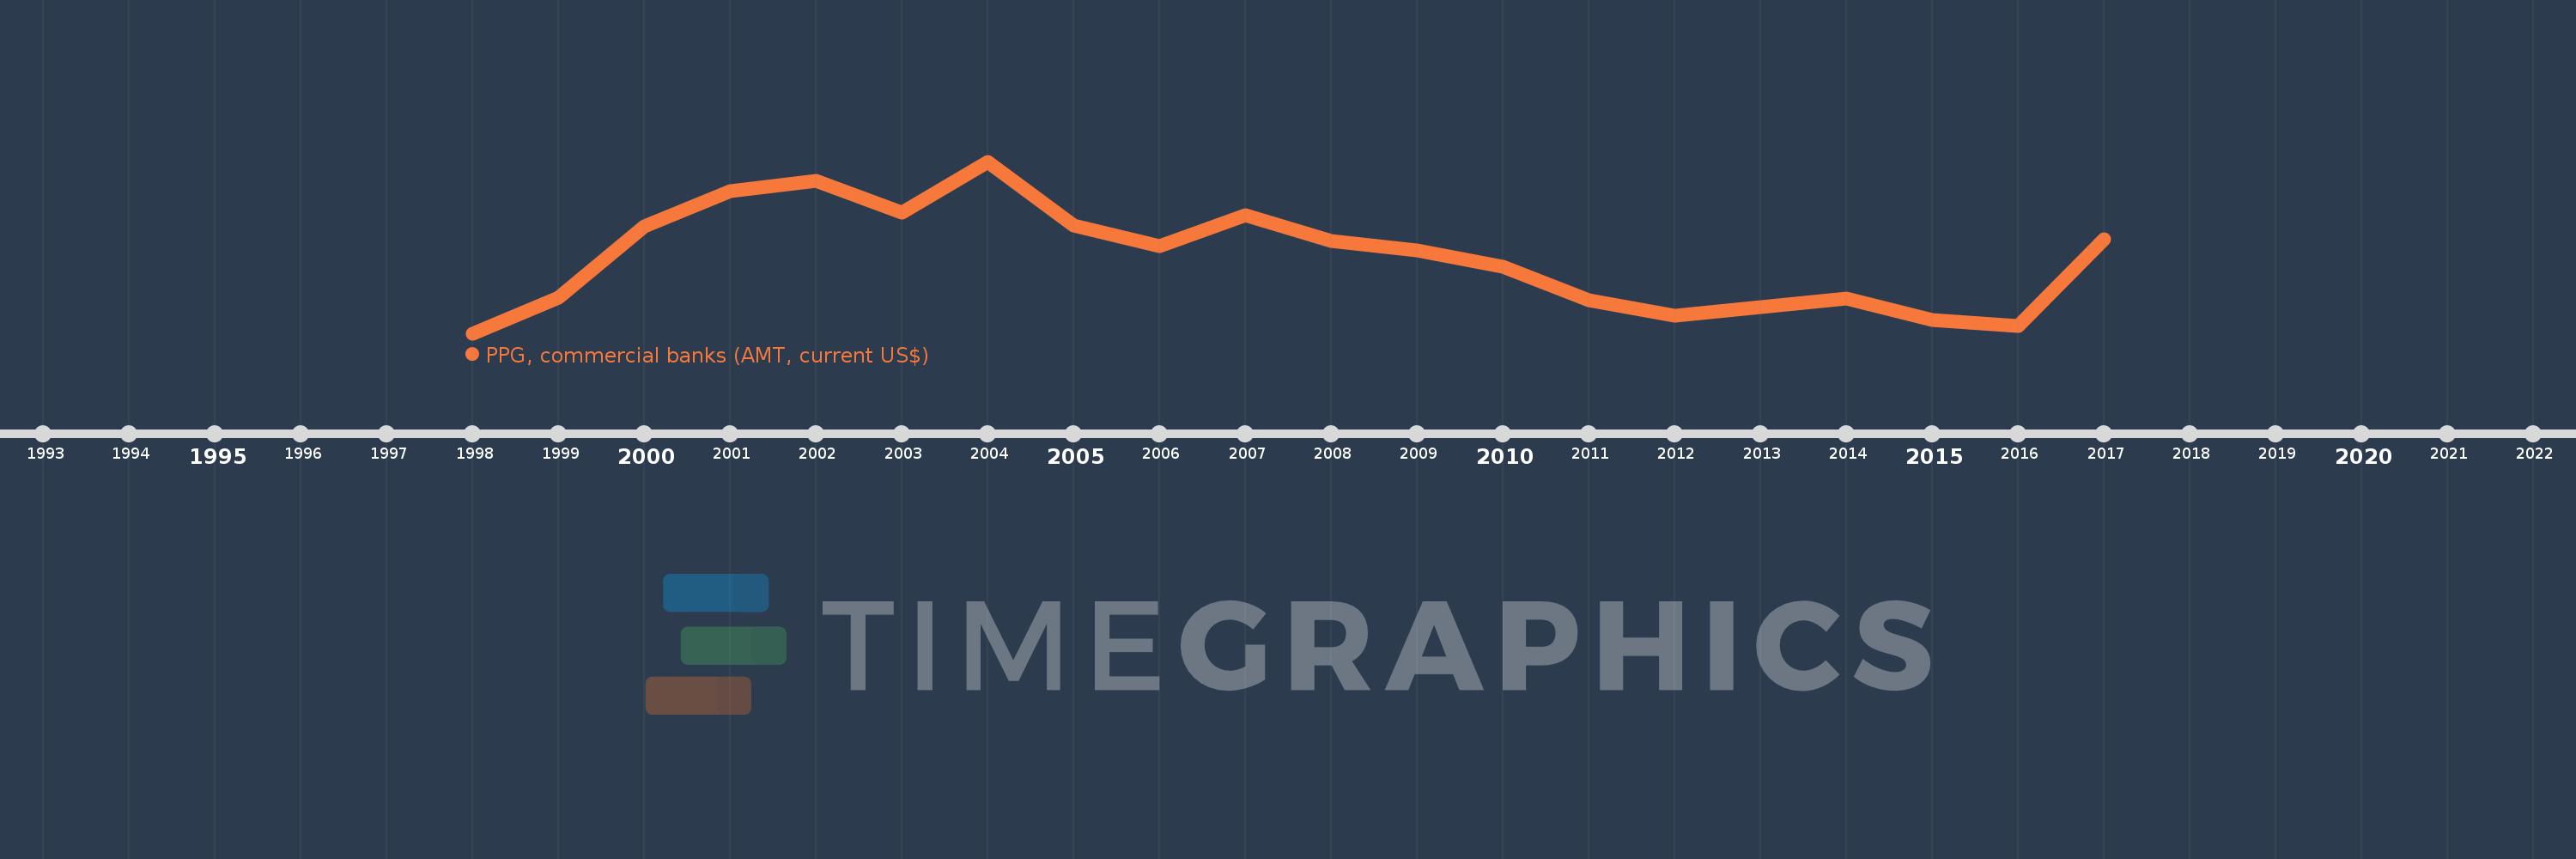
PPG, commercial banks (AMT, current US$)
2017,2016,2015,2014,2013,2012,2011,2010,2009,2008,2007,2006,2005,2004,2003,2002,2001,2000,1999,1998
This statistics in other country:
Timeline:
This timeline shows a graph from 1998 to 2017 of Uzbekistan. No data until 1997. Number of actual observations by date: 20.
Source name:
World Development Indicators
Source organization:
World Bank, International Debt Statistics.
Categories, topics:
External Debt
Last updated:
apr 23, 2017
Indicators value changes by year
Minimum:
12.705 mln
jan 1, 1998
Maximum:
83.966 mln
jan 1, 2004
At the date of observation
Value
Absolute change
Change from previous value
jan 1, 1998
12.705 mln
+12.705 mln
0.0%
jan 1, 1999
27.539 mln
+14.834 mln
116.76%
jan 1, 2000
56.939 mln
+29.4 mln
106.76%
jan 1, 2001
71.615 mln
+14.676 mln
25.77%
jan 1, 2002
76.039 mln
+4.424 mln
6.18%
jan 1, 2003
62.808 mln
-13.231 mln
-17.4%
jan 1, 2004
83.966 mln
+21.158 mln
33.69%
jan 1, 2005
57.35 mln
-26.616 mln
-31.7%
jan 1, 2006
48.932 mln
-8.418 mln
-14.68%
jan 1, 2007
61.735 mln
+12.803 mln
26.16%
jan 1, 2008
51.052 mln
-10.683 mln
-17.3%
jan 1, 2009
47.228 mln
-3.824 mln
-7.49%
jan 1, 2010
40.144 mln
-7.084 mln
-15.0%
jan 1, 2011
26.552 mln
-13.592 mln
-33.86%
jan 1, 2012
20.171 mln
-6.381 mln
-24.03%
jan 1, 2013
23.465 mln
+3.294 mln
16.33%
jan 1, 2014
27.094 mln
+3.629 mln
15.47%
jan 1, 2015
18.372 mln
-8.722 mln
-32.19%
jan 1, 2016
15.799 mln
-2.573 mln
-14.01%
jan 1, 2017
51.762 mln
+35.963 mln
227.63%
Ranking of countries by current statistics by years


Comments: