29
/
en
AIzaSyAYiBZKx7MnpbEhh9jyipgxe19OcubqV5w
April 1, 2024
90315
Botswana
BWA
true
2
1
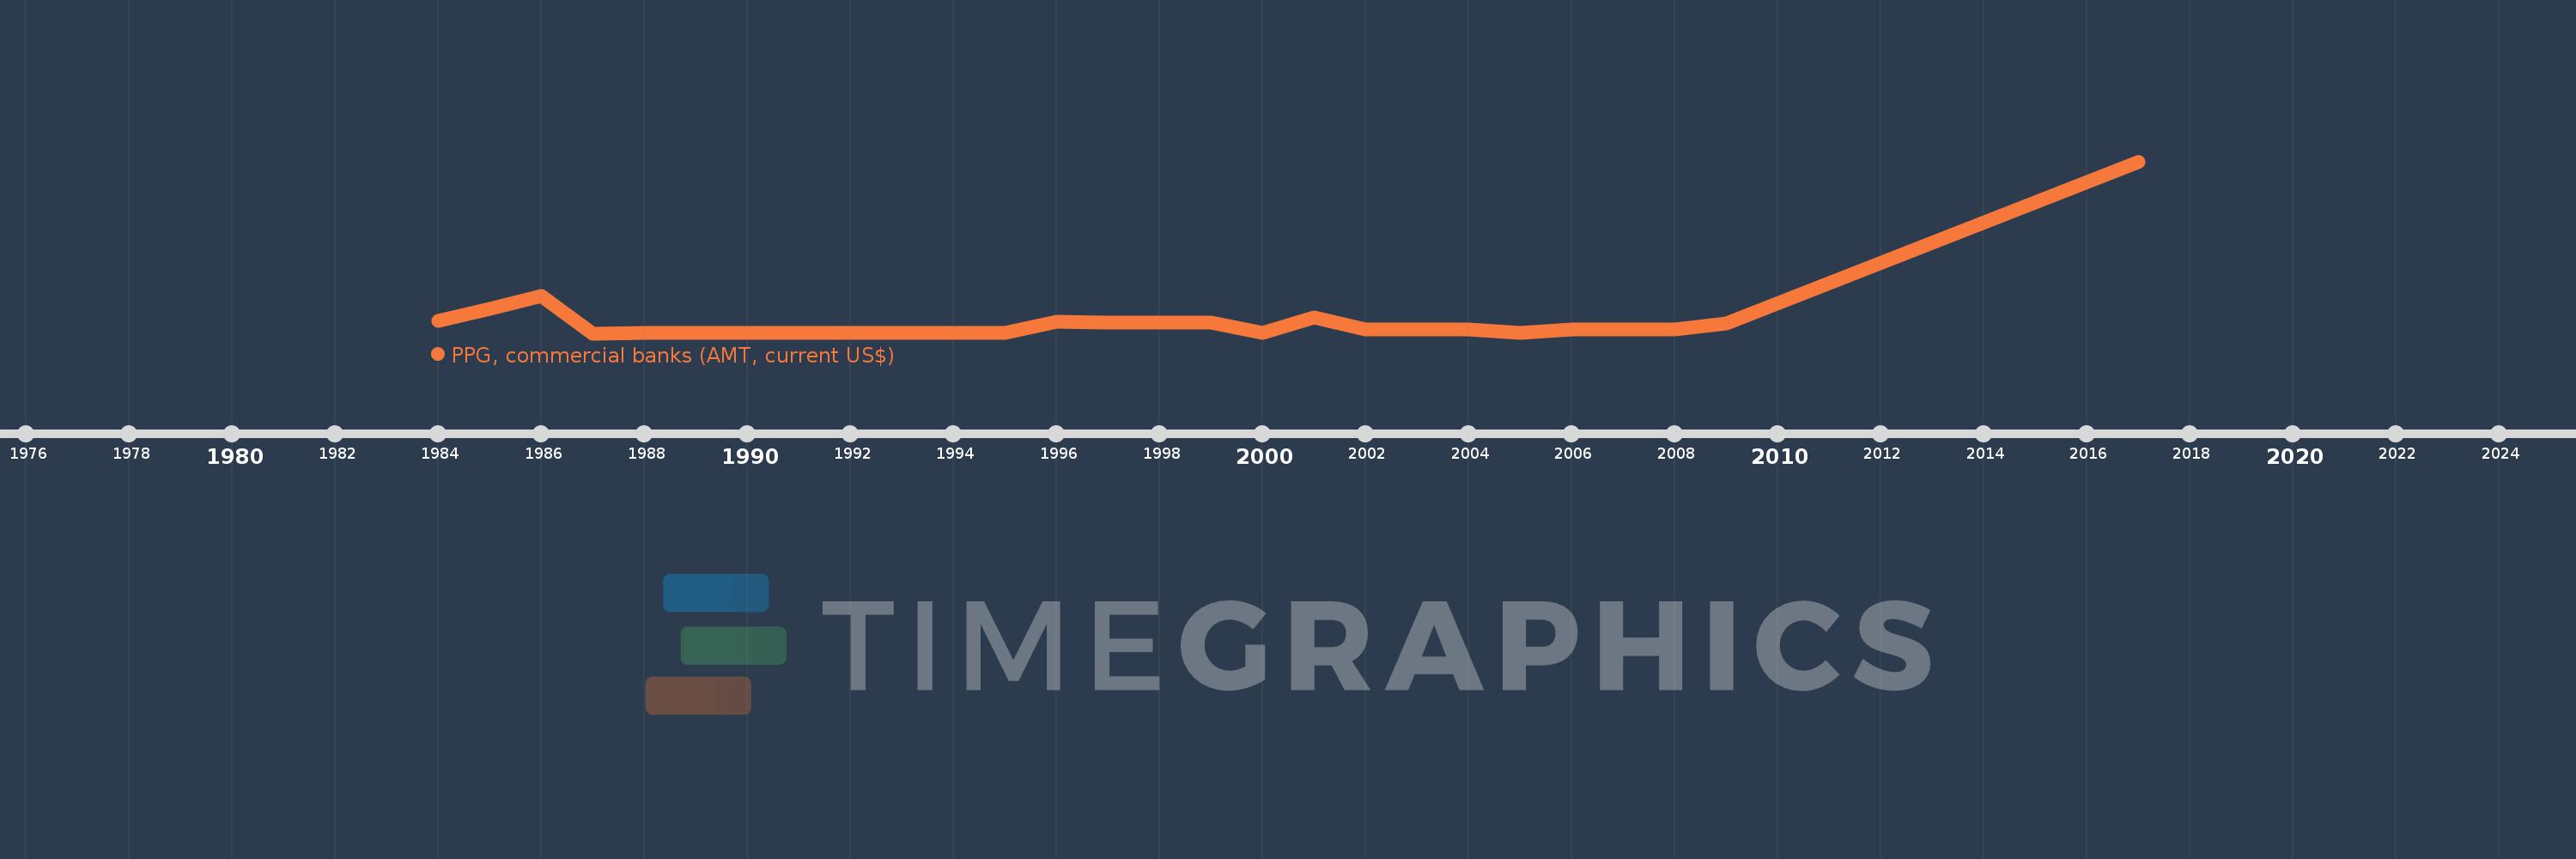
PPG, commercial banks (AMT, current US$)
2017,2009,2008,2007,2006,2005,2004,2003,2002,2001,2000,1999,1998,1997,1996,1995,1994,1993,1992,1991,1990,1989,1988,1987,1986,1985,1984
This statistics in other country:
Timeline:
This timeline shows a graph from 1984 to 2017 of Botswana. No data until 1983. Number of actual observations by date: 27.
Source name:
World Development Indicators
Source organization:
World Bank, International Debt Statistics.
Categories, topics:
External Debt
Last updated:
apr 23, 2017
Indicators value changes by year
Maximum:
68.929 mln
jan 1, 2017
At the date of observation
Value
Absolute change
Change from previous value
jan 1, 1984
5.0 mln
+5.0 mln
0.0%
jan 1, 1985
10.0 mln
+5.0 mln
100.0%
jan 1, 1986
15.013 mln
+5.013 mln
50.13%
jan 1, 1987
17.0K
-14.996 mln
-99.89%
jan 1, 1988
20.0K
+3.0K
17.65%
jan 1, 1989
148.0K
+128.0K
640.0%
jan 1, 1990
138.0K
-10.0K
-6.76%
jan 1, 1991
162.0K
+24.0K
17.39%
jan 1, 1992
156.0K
-6.0K
-3.7%
jan 1, 1993
167.0K
+11.0K
7.05%
jan 1, 1994
170.0K
+3.0K
1.8%
jan 1, 1995
159.0K
-11.0K
-6.47%
jan 1, 1996
4.542 mln
+4.383 mln
2.76K%
jan 1, 1997
4.326 mln
-216.0K
-4.76%
jan 1, 1998
4.481 mln
+155.0K
3.58%
jan 1, 1999
4.417 mln
-64.0K
-1.43%
jan 1, 2000
143.0K
-4.274 mln
-96.76%
jan 1, 2001
6.241 mln
+6.098 mln
4.26K%
jan 1, 2002
1.603 mln
-4.638 mln
-74.32%
jan 1, 2003
1.603 mln
0.0
0.0%
jan 1, 2004
1.603 mln
0.0
0.0%
jan 1, 2005
161.0K
-1.442 mln
-89.96%
jan 1, 2006
1.601 mln
+1.44 mln
894.41%
jan 1, 2007
1.604 mln
+3.0K
0.19%
jan 1, 2008
1.604 mln
0.0
0.0%
jan 1, 2009
3.85 mln
+2.246 mln
140.02%
jan 1, 2017
68.929 mln
+65.079 mln
1.69K%
Ranking of countries by current statistics by years


Comments: