29
/
en
AIzaSyAYiBZKx7MnpbEhh9jyipgxe19OcubqV5w
April 1, 2024
200860
Montenegro
MNE
true
2
1
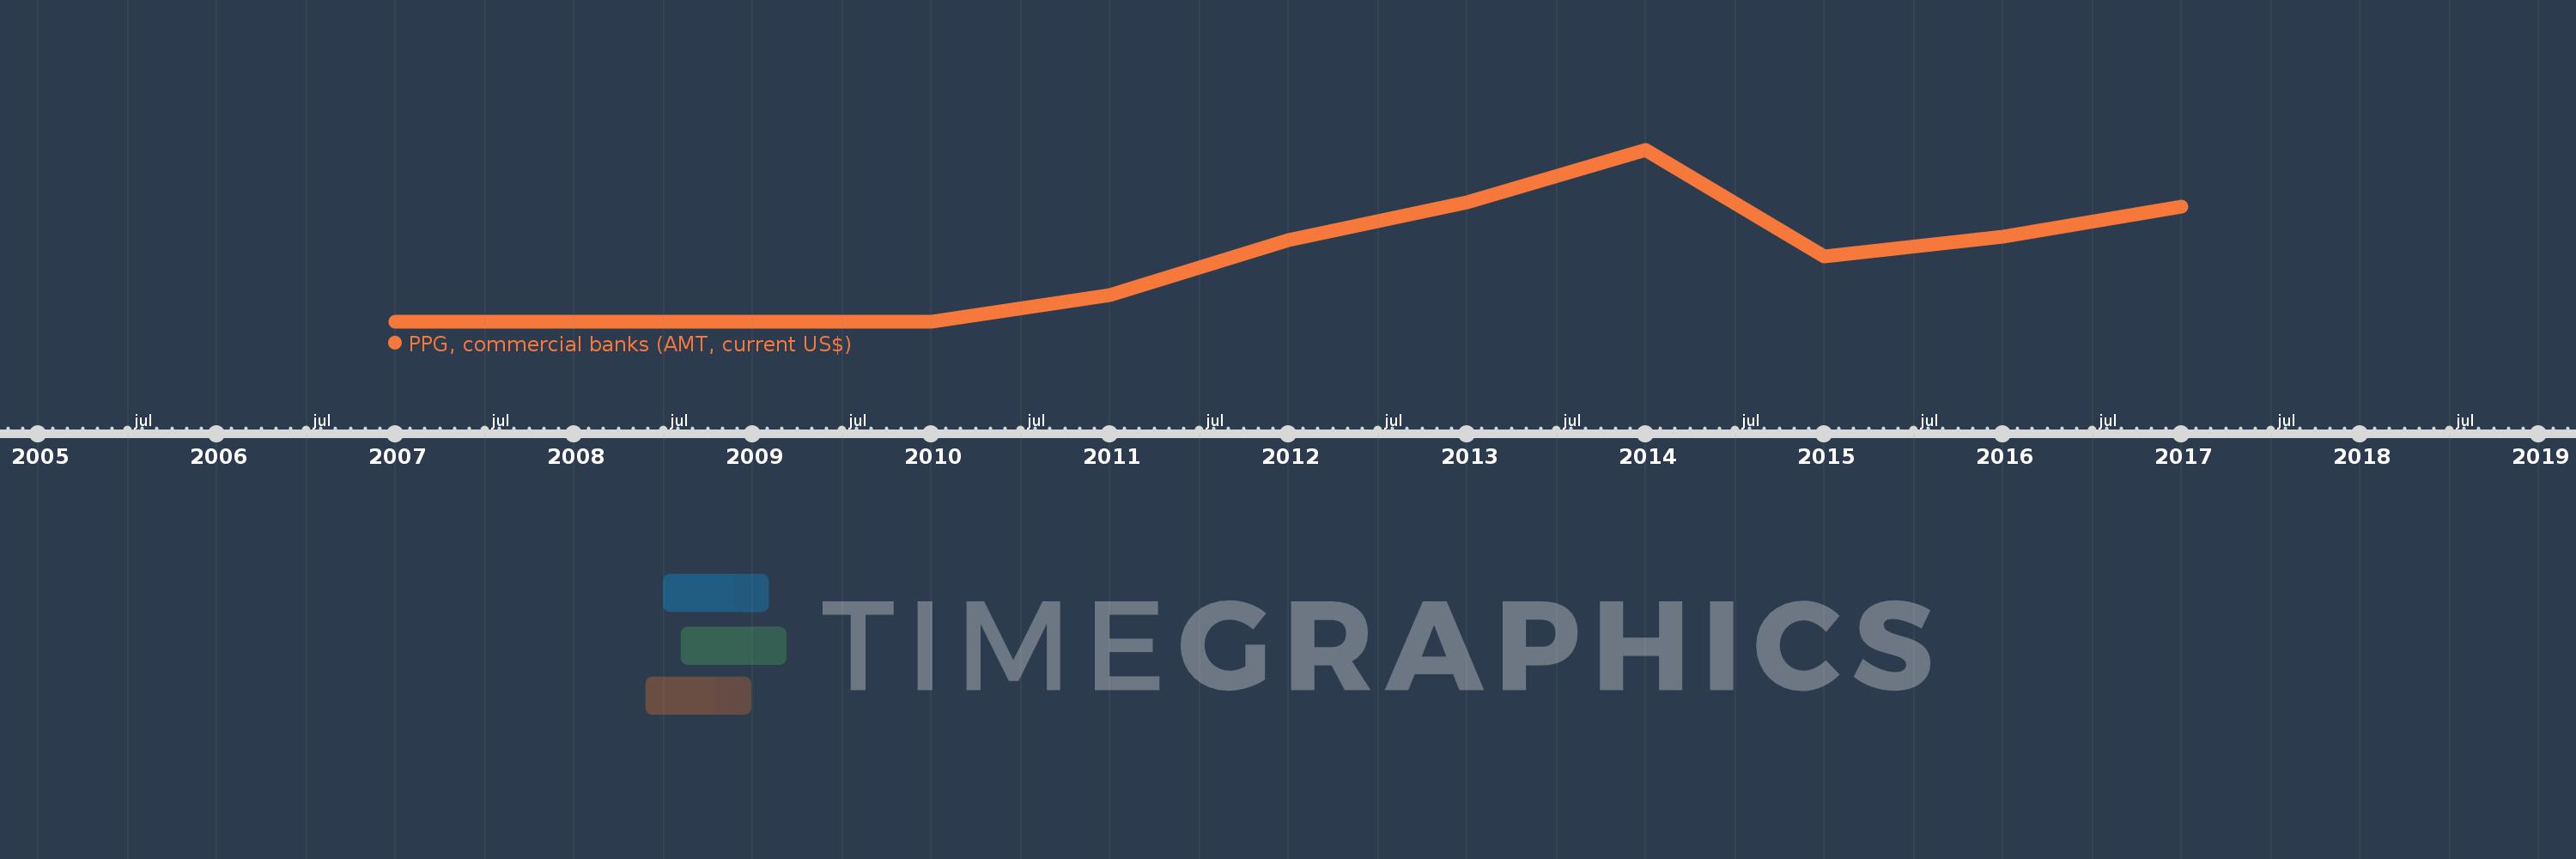
PPG, commercial banks (AMT, current US$)
2017,2016,2015,2014,2013,2012,2011,2010,2009,2008,2007
This statistics in other country:
Timeline:
This timeline shows a graph from 2007 to 2017 of Montenegro. No data until 2006. Number of actual observations by date: 11.
Source name:
World Development Indicators
Source organization:
World Bank, International Debt Statistics.
Categories, topics:
External Debt
Last updated:
apr 23, 2017
Indicators value changes by year
Minimum:
400.0K
jan 1, 2007
Maximum:
169.544 mln
jan 1, 2014
At the date of observation
Value
Absolute change
Change from previous value
jan 1, 2007
400.0K
+400.0K
0.0%
jan 1, 2008
684.0K
+284.0K
71.0%
jan 1, 2009
1.056 mln
+372.0K
54.39%
jan 1, 2010
802.0K
-254.0K
-24.05%
jan 1, 2011
26.708 mln
+25.906 mln
3.23K%
jan 1, 2012
81.096 mln
+54.388 mln
203.64%
jan 1, 2013
117.807 mln
+36.711 mln
45.27%
jan 1, 2014
169.544 mln
+51.737 mln
43.92%
jan 1, 2015
64.676 mln
-104.868 mln
-61.85%
jan 1, 2016
84.792 mln
+20.116 mln
31.1%
jan 1, 2017
113.757 mln
+28.965 mln
34.16%
Ranking of countries by current statistics by years


Comments: