29
/
en
AIzaSyAYiBZKx7MnpbEhh9jyipgxe19OcubqV5w
April 1, 2024
203441
Mozambique
MOZ
true
2
1
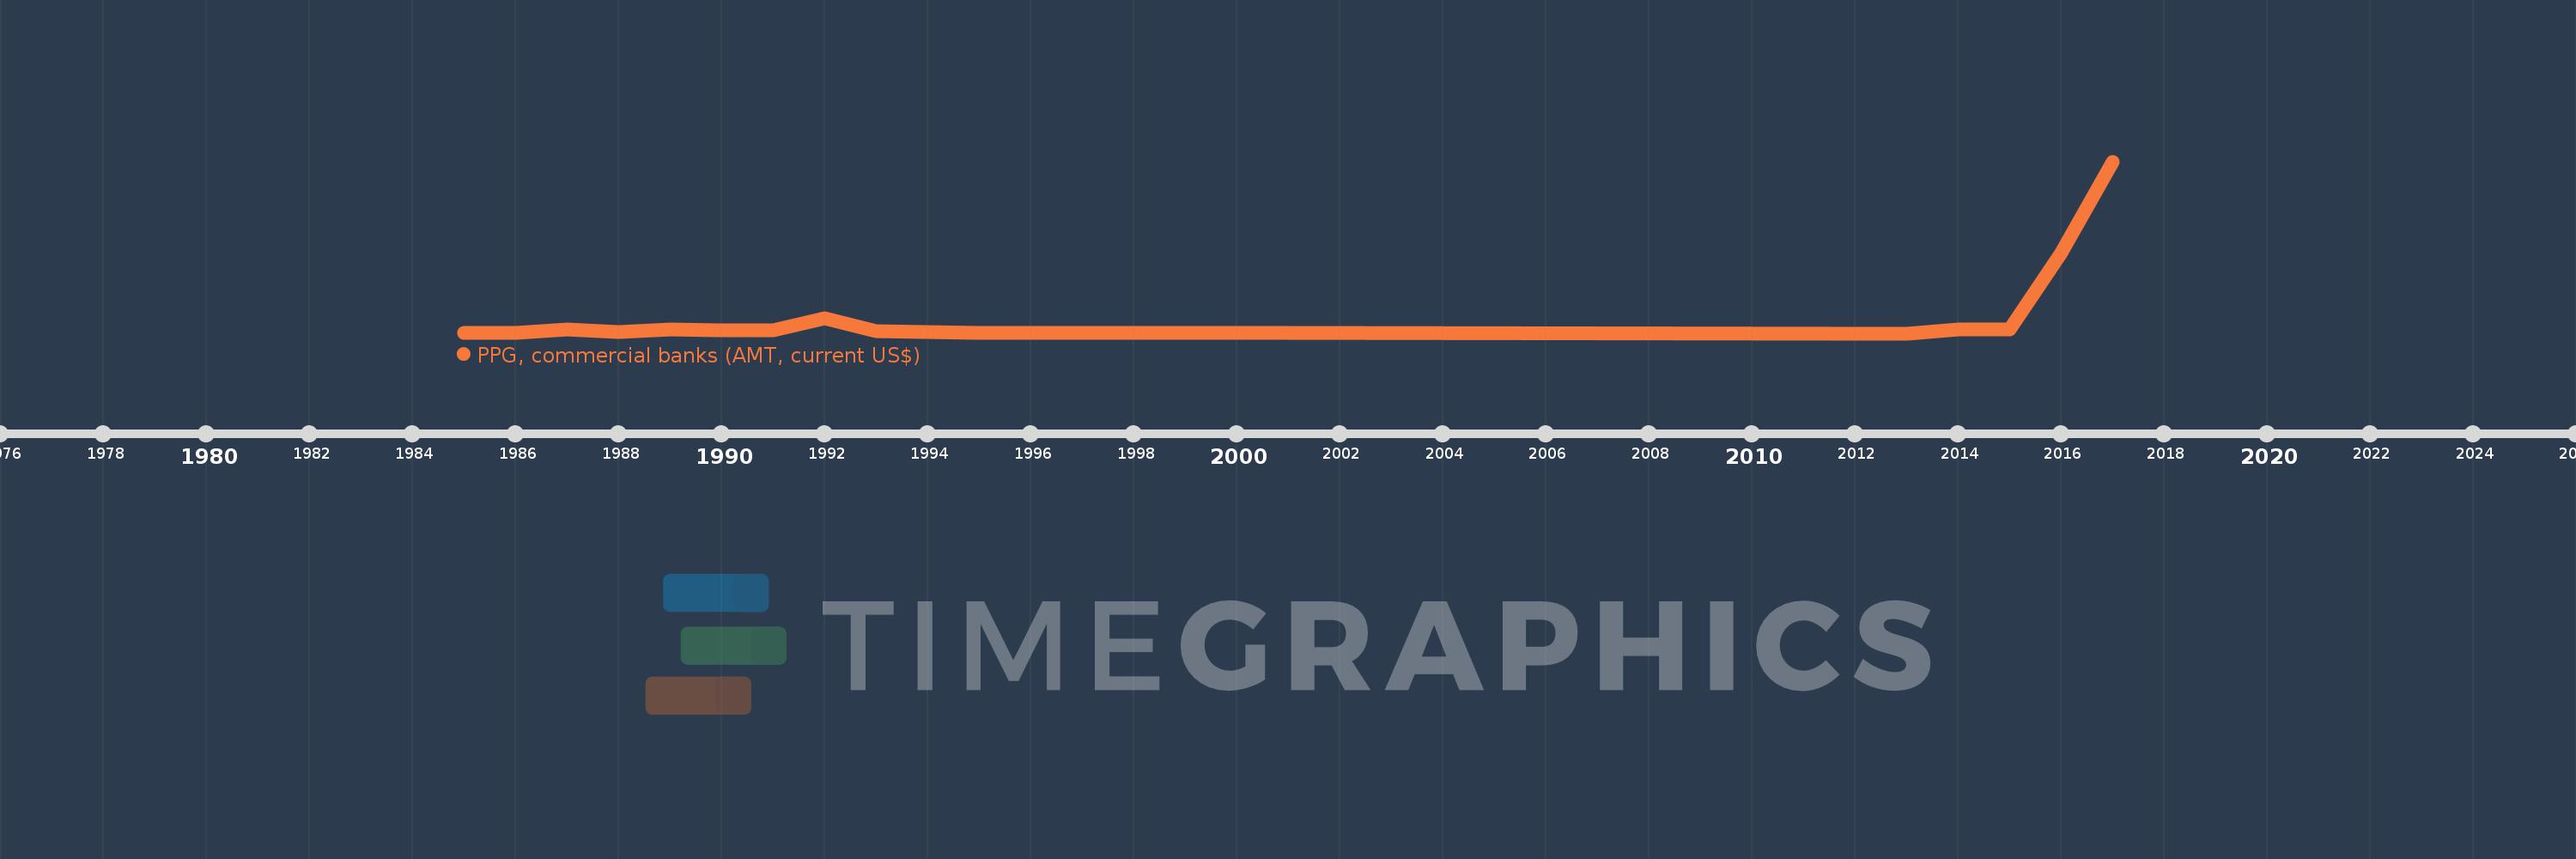
PPG, commercial banks (AMT, current US$)
2017,2016,2015,2014,2013,2001,2000,1998,1997,1995,1993,1992,1991,1990,1989,1988,1987,1986,1985
This statistics in other country:
Timeline:
This timeline shows a graph from 1985 to 2017 of Mozambique. No data until 1984. Number of actual observations by date: 19.
Source name:
World Development Indicators
Source organization:
World Bank, International Debt Statistics.
Categories, topics:
External Debt
Last updated:
apr 23, 2017
Indicators value changes by year
Maximum:
171.276 mln
jan 1, 2017
At the date of observation
Value
Absolute change
Change from previous value
jan 1, 1985
44.0K
+44.0K
0.0%
jan 1, 1986
837.0K
+793.0K
1.8K%
jan 1, 1987
4.178 mln
+3.341 mln
399.16%
jan 1, 1988
1.117 mln
-3.061 mln
-73.26%
jan 1, 1989
4.069 mln
+2.952 mln
264.28%
jan 1, 1990
3.091 mln
-978.0K
-24.04%
jan 1, 1991
3.403 mln
+312.0K
10.09%
jan 1, 1992
14.609 mln
+11.206 mln
329.3%
jan 1, 1993
2.21 mln
-12.399 mln
-84.87%
jan 1, 1995
515.0K
-1.695 mln
-76.7%
jan 1, 1997
115.0K
-400.0K
-77.67%
jan 1, 1998
8.0K
-107.0K
-93.04%
jan 1, 2000
442.0K
+434.0K
5.42K%
jan 1, 2001
674.0K
+232.0K
52.49%
jan 1, 2013
0.0
-674.0K
-100.0%
jan 1, 2014
4.104 mln
+4.104 mln
%
jan 1, 2015
4.244 mln
+140.0K
3.41%
jan 1, 2016
79.89 mln
+75.646 mln
1.78K%
jan 1, 2017
171.276 mln
+91.386 mln
114.39%
Ranking of countries by current statistics by years


Comments: