30
/
AIzaSyAYiBZKx7MnpbEhh9jyipgxe19OcubqV5w
April 1, 2024
276108
United Kingdom
GBR
true
2
1
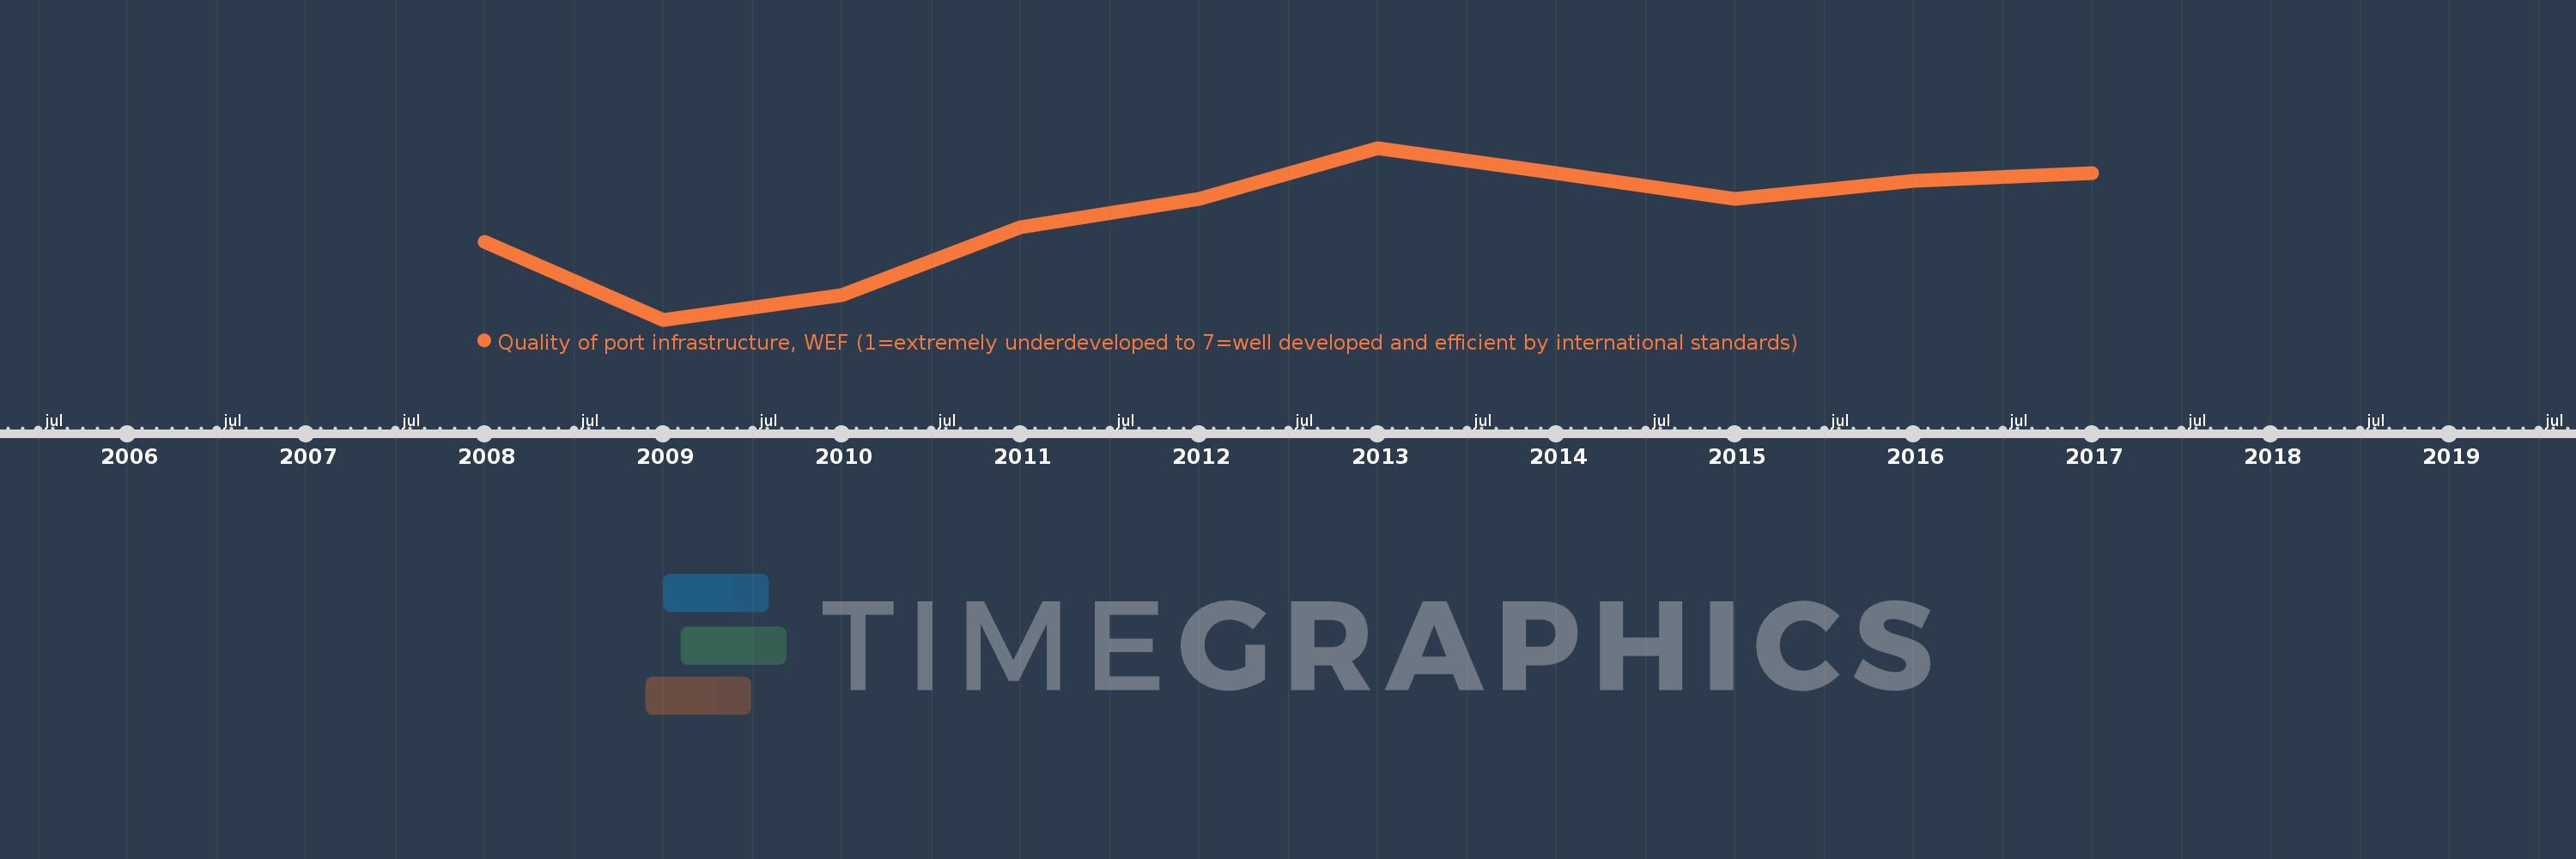
Quality of port infrastructure, WEF (1=extremely underdeveloped to 7=well developed and efficient by international standards)
2017,2016,2015,2014,2013,2012,2011,2010,2009,2008
