29
/
en
AIzaSyAYiBZKx7MnpbEhh9jyipgxe19OcubqV5w
April 1, 2024
258923
Syrian Arab Republic
SYR
true
2
1
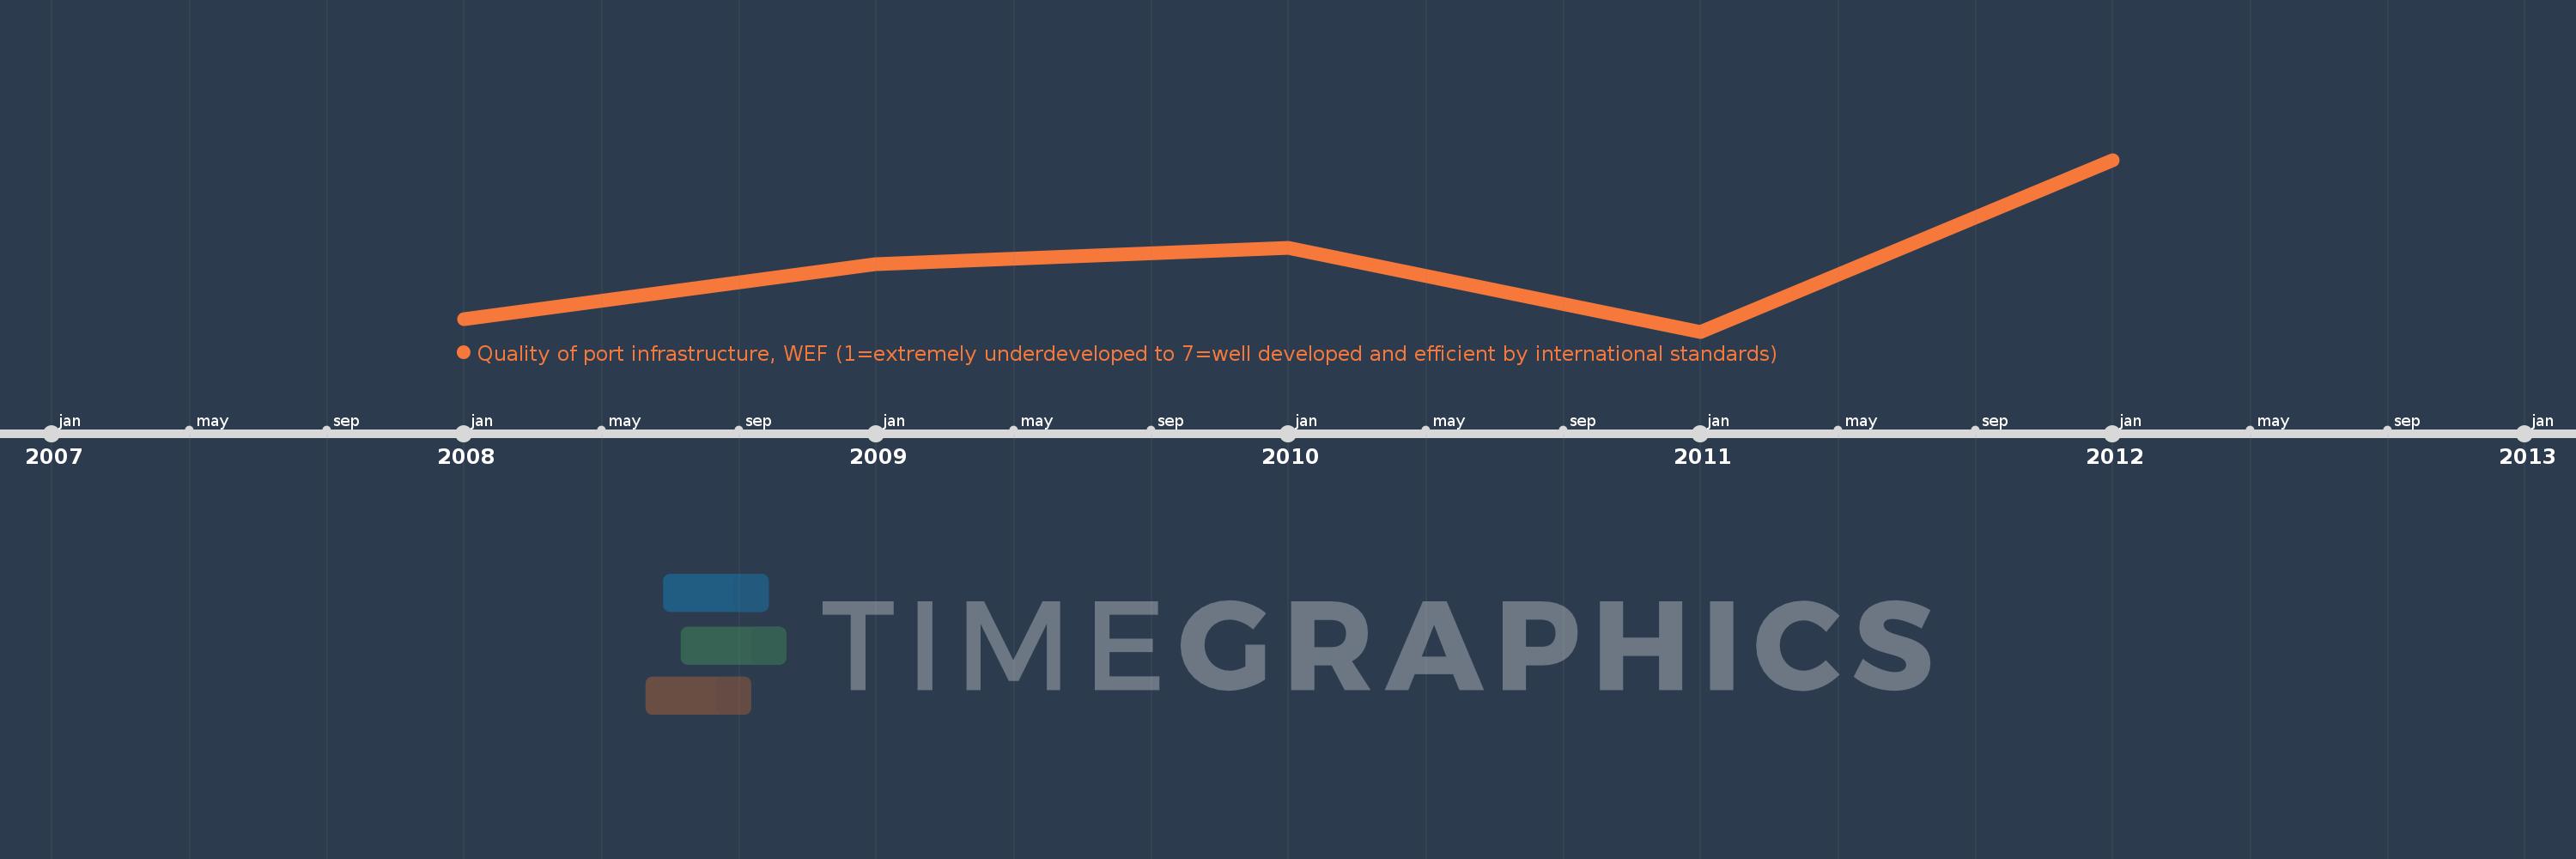
Quality of port infrastructure, WEF (1=extremely underdeveloped to 7=well developed and efficient by international standards)
2012,2011,2010,2009,2008
This statistics in other country:
Timeline:
This timeline shows a graph from 2008 to 2012 of Syrian Arab Republic. No data until 2007. Number of actual observations by date: 5.
Source name:
World Development Indicators
Source organization:
World Economic Forum, Global Competiveness Report.
Categories, topics:
Infrastructure
Last updated:
apr 23, 2017
Indicators value changes by year
At the date of observation
Value
Absolute change
Change from previous value
jan 1, 2008
3.149
+3.149
0.0%
jan 1, 2009
3.235
+0.086
2.72%
jan 1, 2010
3.261
+0.026
0.81%
jan 1, 2011
3.129
-0.132
-4.04%
jan 1, 2012
3.4
+0.271
8.66%
Ranking of countries by current statistics by years


Comments: