29
/
en
AIzaSyAYiBZKx7MnpbEhh9jyipgxe19OcubqV5w
April 1, 2024
268646
Tunisia
TUN
true
2
1
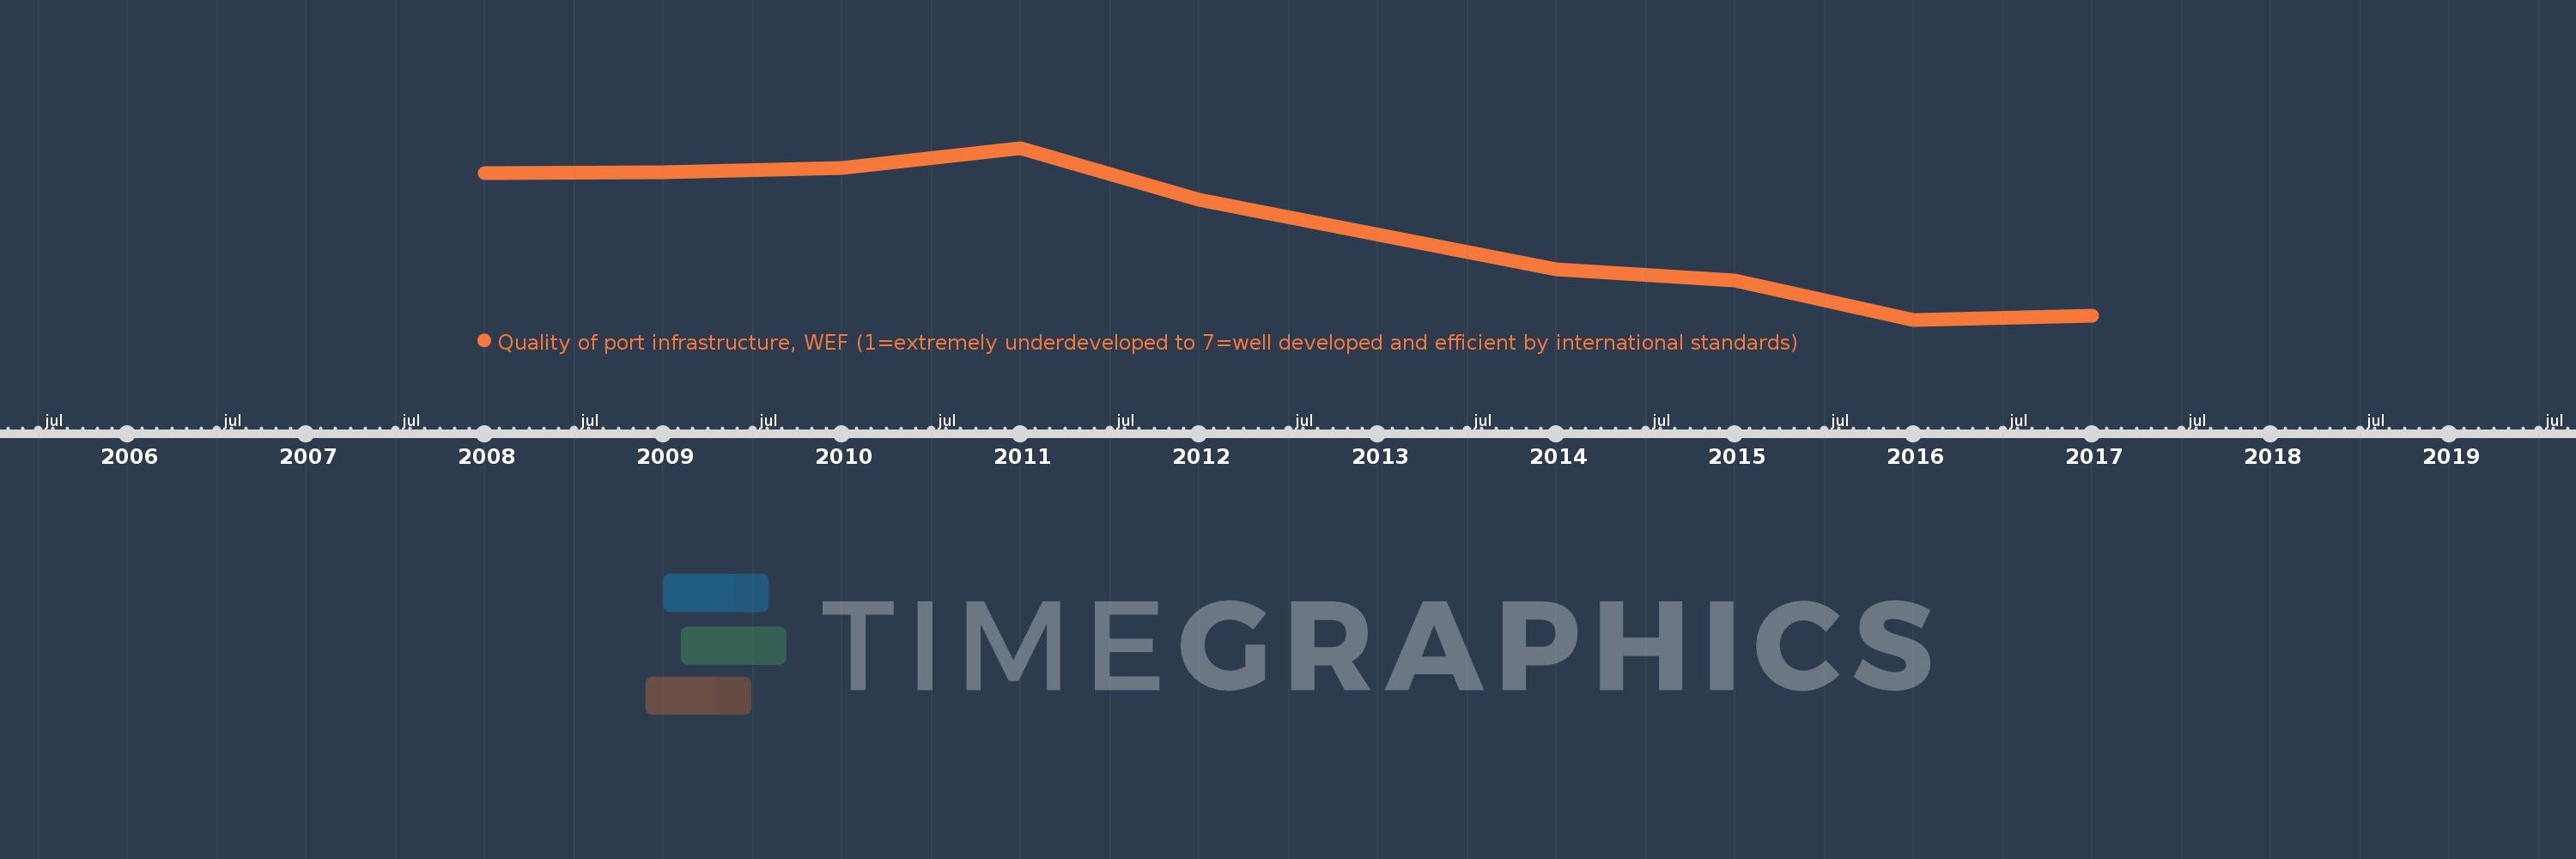
Quality of port infrastructure, WEF (1=extremely underdeveloped to 7=well developed and efficient by international standards)
2017,2016,2015,2014,2012,2011,2010,2009,2008
Global statistics library →Tunisia →Quality of port infrastructure, WEF (1=extremely underdeveloped to 7=well developed and efficient by international standards)
This statistics in other country:
Timeline:
This timeline shows a graph from 2008 to 2017 of Tunisia. No data until 2007. Number of actual observations by date: 9.
Source name:
World Development Indicators
Source organization:
World Economic Forum, Global Competiveness Report.
Categories, topics:
Infrastructure
Last updated:
apr 23, 2017
Indicators value changes by year
At the date of observation
Value
Absolute change
Change from previous value
jan 1, 2008
4.829
+4.829
0.0%
jan 1, 2009
4.833
+0.004
0.08%
jan 1, 2010
4.872
+0.039
0.81%
jan 1, 2011
5.046
+0.174
3.57%
jan 1, 2012
4.6
-0.446
-8.84%
jan 1, 2014
4.0
-0.6
-13.04%
jan 1, 2015
3.9
-0.1
-2.5%
jan 1, 2016
3.564
-0.336
-8.6%
jan 1, 2017
3.6
+0.036
1.0%
Ranking of countries by current statistics by years


Comments: