29
/
en
AIzaSyAYiBZKx7MnpbEhh9jyipgxe19OcubqV5w
April 1, 2024
43834
Latin America & the Caribbean (IDA & IBRD countries)
TLA
false
2
1
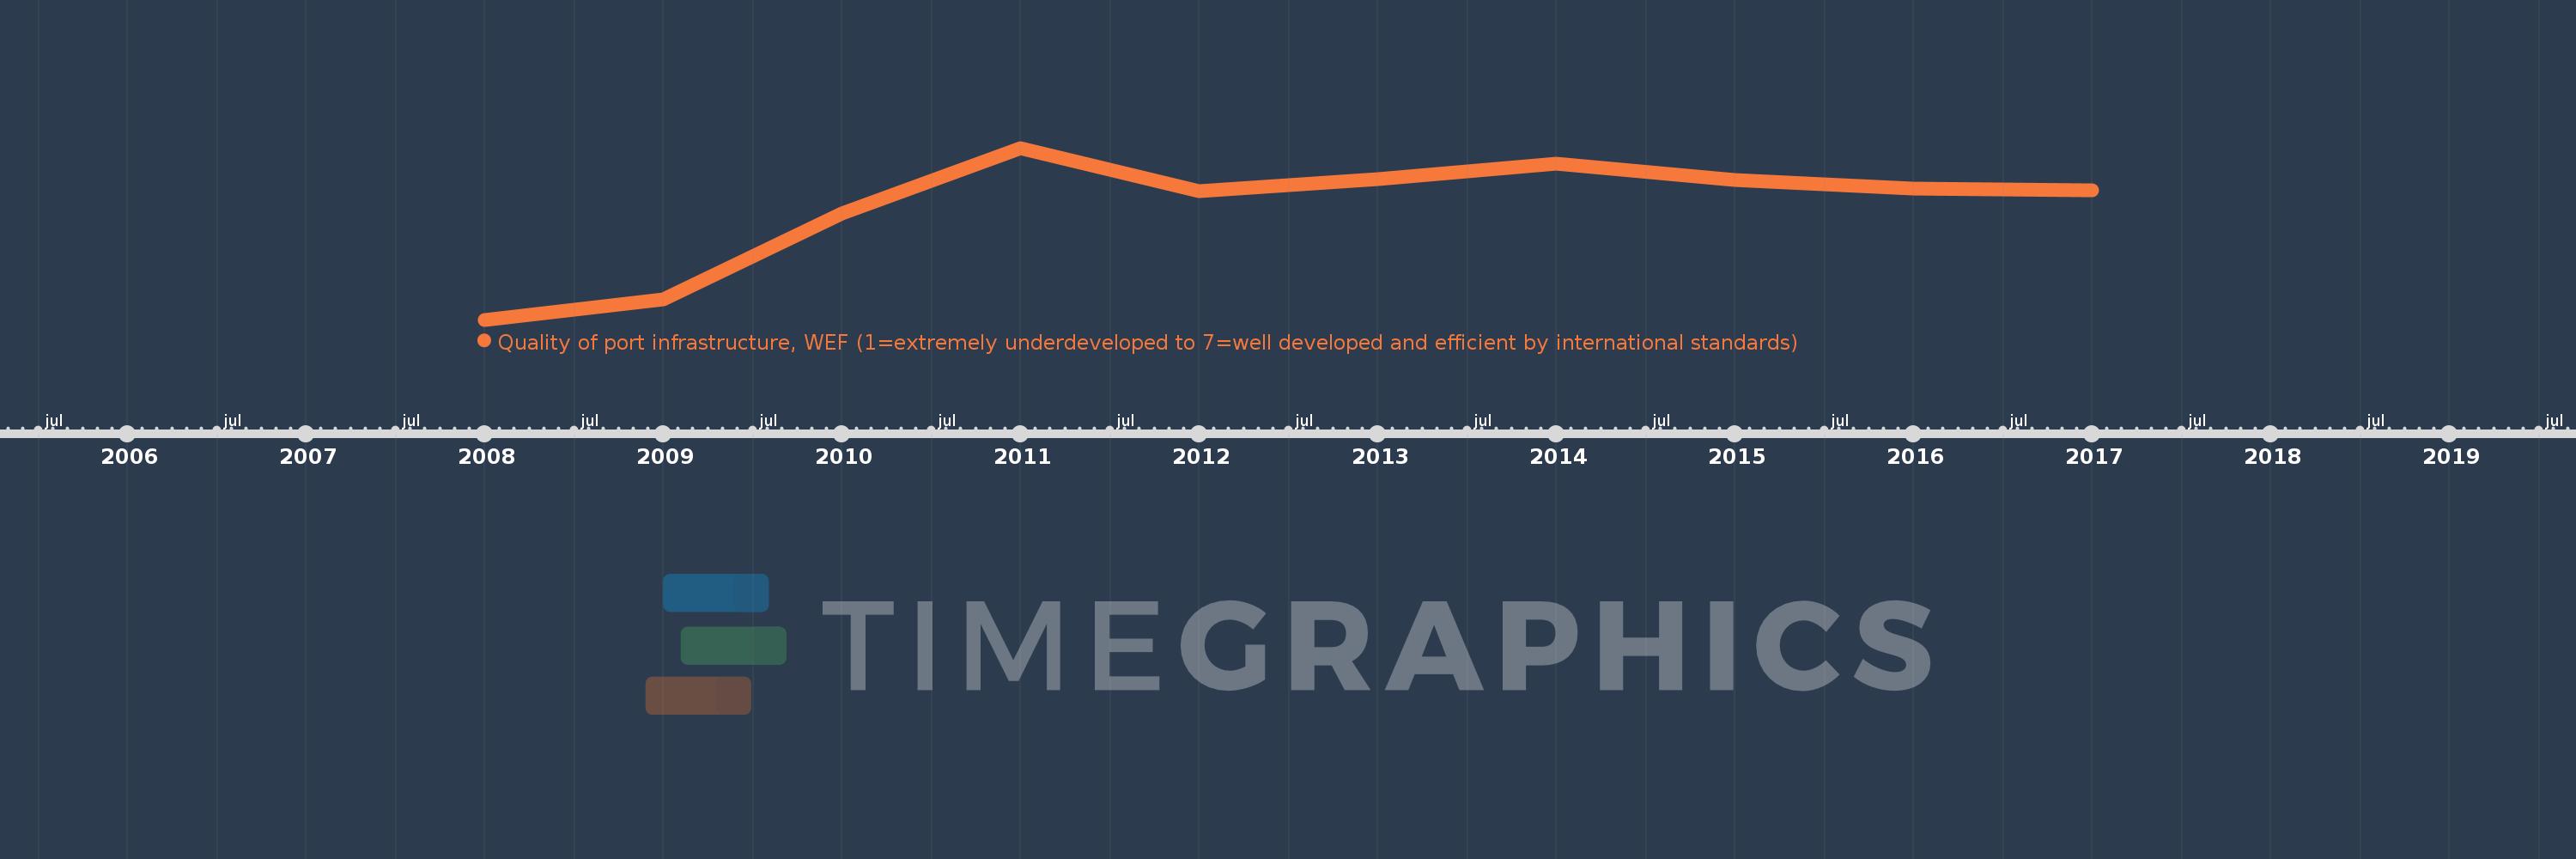
Quality of port infrastructure, WEF (1=extremely underdeveloped to 7=well developed and efficient by international standards)
2017,2016,2015,2014,2013,2012,2011,2010,2009,2008
This statistics in other country:
Timeline:
This timeline shows a graph from 2008 to 2017 of Latin America & the Caribbean (IDA & IBRD countries). No data until 2007. Number of actual observations by date: 10.
Source name:
World Development Indicators
Source organization:
World Economic Forum, Global Competiveness Report.
Categories, topics:
Infrastructure
Last updated:
apr 23, 2017
Indicators value changes by year
At the date of observation
Value
Absolute change
Change from previous value
jan 1, 2008
3.439
+3.439
0.0%
jan 1, 2009
3.5
+0.06
1.75%
jan 1, 2010
3.76
+0.261
7.45%
jan 1, 2011
3.96
+0.2
5.31%
jan 1, 2012
3.829
-0.131
-3.3%
jan 1, 2013
3.865
+0.036
0.94%
jan 1, 2014
3.913
+0.048
1.24%
jan 1, 2015
3.864
-0.049
-1.26%
jan 1, 2016
3.836
-0.028
-0.73%
jan 1, 2017
3.832
-0.004
-0.1%
Ranking of countries by current statistics by years


Comments: