29
/
en
AIzaSyAYiBZKx7MnpbEhh9jyipgxe19OcubqV5w
April 1, 2024
274076
Ukraine
UKR
true
2
1
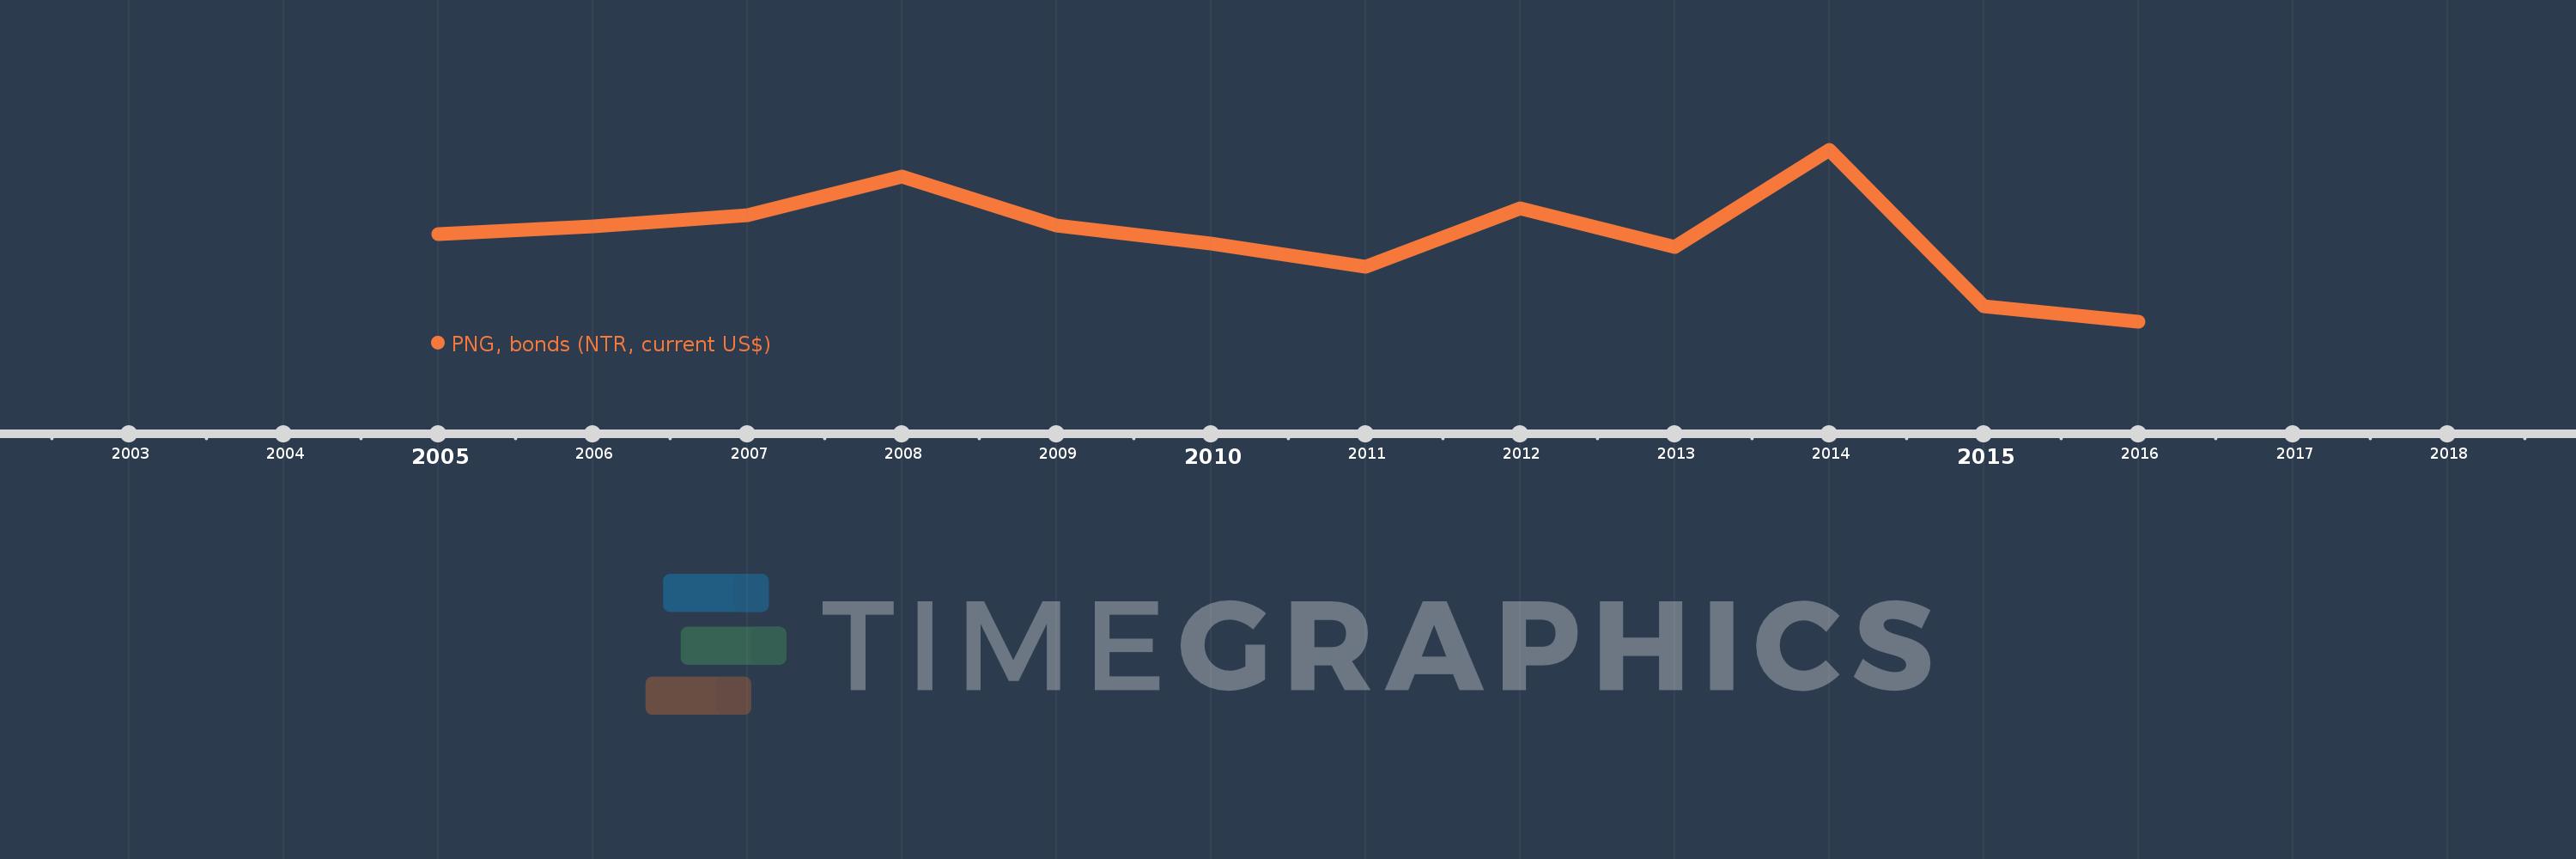
PNG, bonds (NTR, current US$)
2016,2015,2014,2013,2012,2011,2010,2009,2008,2007,2006,2005
This statistics in other country:
Timeline:
This timeline shows a graph from 2005 to 2016 of Ukraine. No data until 2004. Number of actual observations by date: 12.
Source name:
World Development Indicators
Source organization:
World Bank, International Debt Statistics.
Categories, topics:
External Debt
Last updated:
apr 23, 2017
Indicators value changes by year
Minimum:
-3.432 bln
jan 1, 2016
Maximum:
3.478 bln
jan 1, 2014
At the date of observation
Value
Absolute change
Change from previous value
jan 1, 2005
100.0 mln
+100.0 mln
0.0%
jan 1, 2006
408.703 mln
+308.703 mln
308.7%
jan 1, 2007
873.562 mln
+464.859 mln
113.74%
jan 1, 2008
2.423 bln
+1.55 bln
177.39%
jan 1, 2009
444.285 mln
-1.979 bln
-81.67%
jan 1, 2010
-272.469 mln
-716.754 mln
-161.33%
jan 1, 2011
-1.208 bln
-935.584 mln
343.37%
jan 1, 2012
1.127 bln
+2.336 bln
-193.33%
jan 1, 2013
-403.145 mln
-1.531 bln
-135.76%
jan 1, 2014
3.478 bln
+3.882 bln
-962.83%
jan 1, 2015
-2.802 bln
-6.28 bln
-180.55%
jan 1, 2016
-3.432 bln
-629.828 mln
22.48%
Ranking of countries by current statistics by years


Comments: