29
/
en
AIzaSyAYiBZKx7MnpbEhh9jyipgxe19OcubqV5w
April 1, 2024
163053
Jamaica
JAM
true
2
1
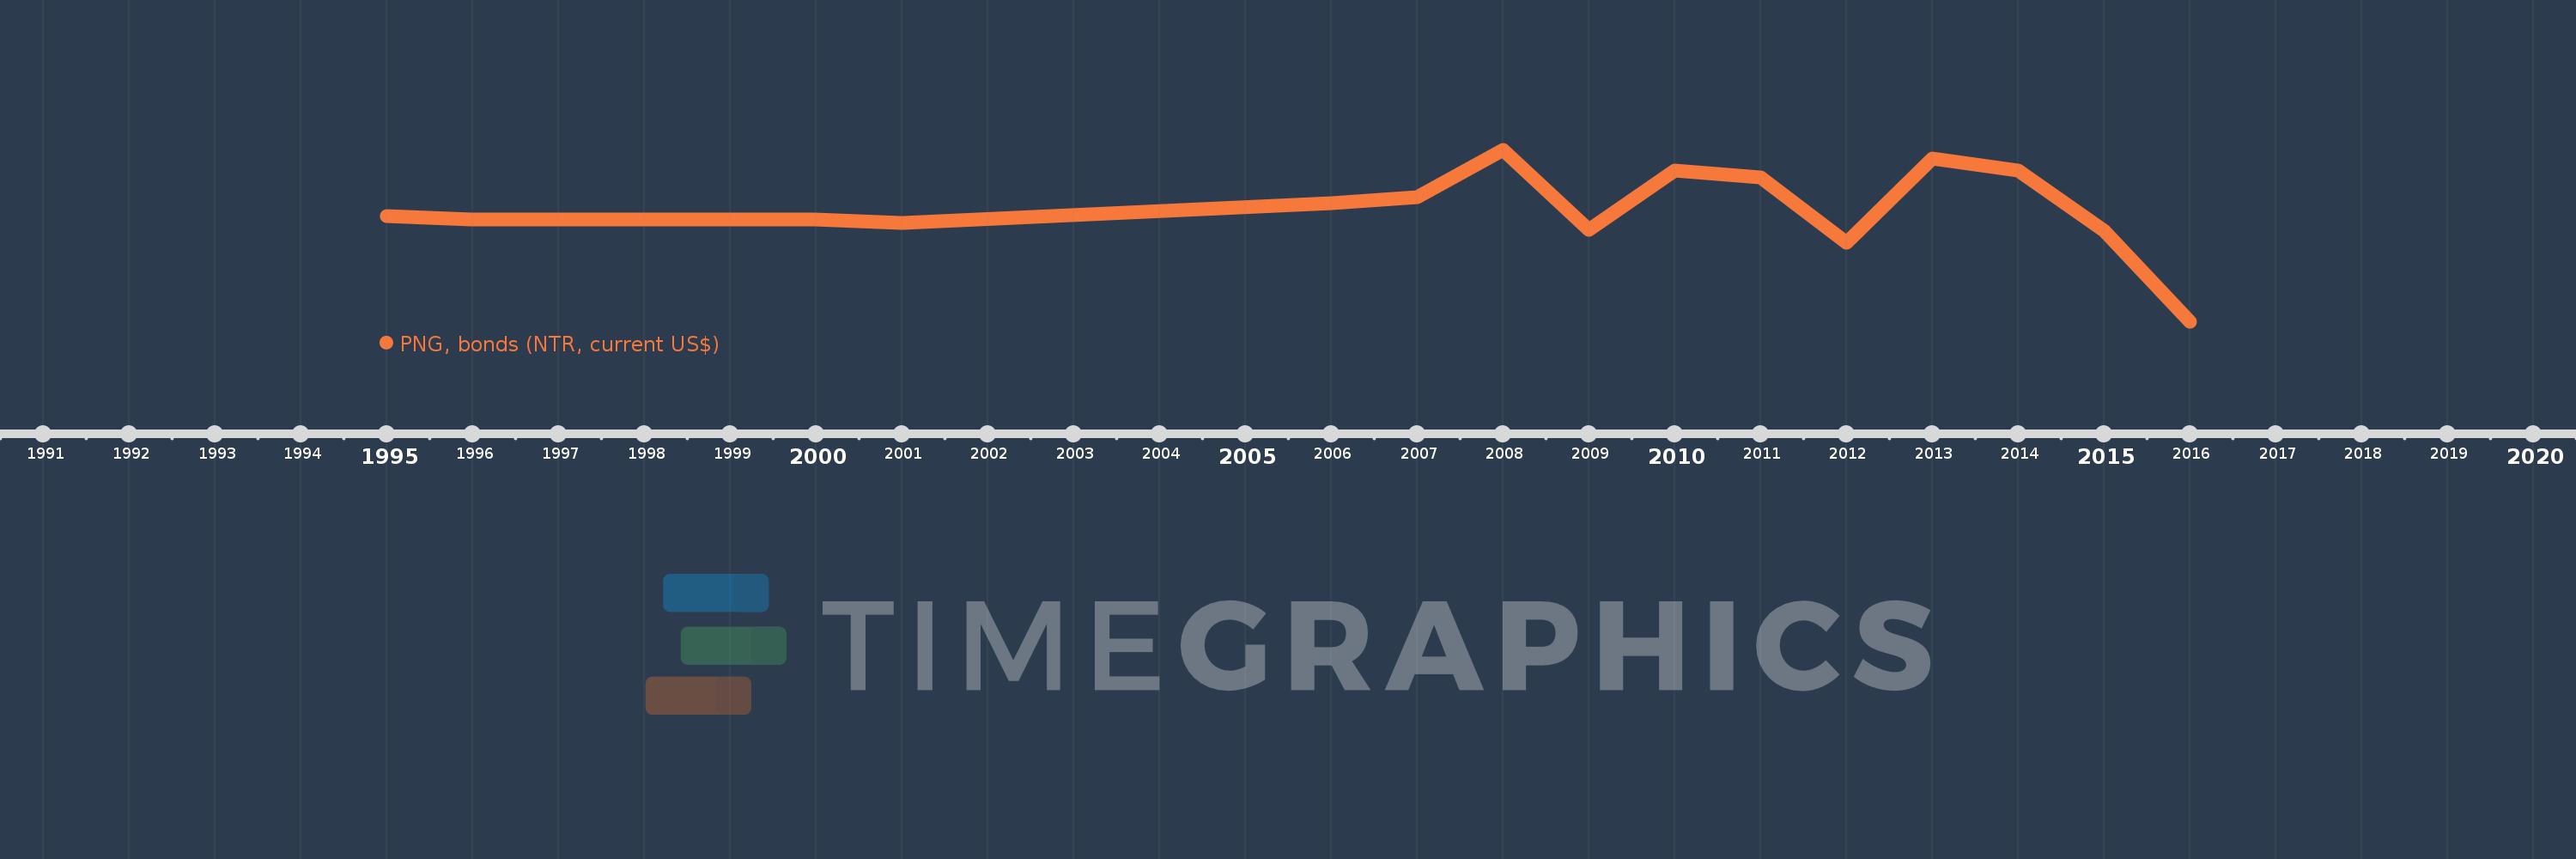
PNG, bonds (NTR, current US$)
2016,2015,2014,2013,2012,2011,2010,2009,2008,2007,2006,2001,2000,1999,1998,1997,1996,1995
This statistics in other country:
Timeline:
This timeline shows a graph from 1995 to 2016 of Jamaica. No data until 1994. Number of actual observations by date: 18.
Source name:
World Development Indicators
Source organization:
World Bank, International Debt Statistics.
Categories, topics:
External Debt
Last updated:
apr 23, 2017
Indicators value changes by year
Minimum:
-1.807 bln
jan 1, 2016
Maximum:
1.219 bln
jan 1, 2008
At the date of observation
Value
Absolute change
Change from previous value
jan 1, 1995
54.304 mln
+54.304 mln
0.0%
jan 1, 1996
-4.64 mln
-58.944 mln
-108.54%
jan 1, 1997
-4.64 mln
0.0
0.0%
jan 1, 1998
-4.64 mln
0.0
0.0%
jan 1, 1999
-4.64 mln
0.0
0.0%
jan 1, 2000
-4.64 mln
0.0
0.0%
jan 1, 2001
-57.32 mln
-52.68 mln
1.14K%
jan 1, 2006
279.188 mln
+336.508 mln
-587.07%
jan 1, 2007
385.05 mln
+105.862 mln
37.92%
jan 1, 2008
1.219 bln
+834.363 mln
216.69%
jan 1, 2009
-190.537 mln
-1.41 bln
-115.63%
jan 1, 2010
861.134 mln
+1.052 bln
-551.95%
jan 1, 2011
734.862 mln
-126.272 mln
-14.66%
jan 1, 2012
-405.504 mln
-1.14 bln
-155.18%
jan 1, 2013
1.074 bln
+1.48 bln
-364.9%
jan 1, 2014
858.75 mln
-215.411 mln
-20.05%
jan 1, 2015
-201.25 mln
-1.06 bln
-123.44%
jan 1, 2016
-1.807 bln
-1.606 bln
798.12%
Ranking of countries by current statistics by years


Comments: