Download This statistics in other country:
Timeline:
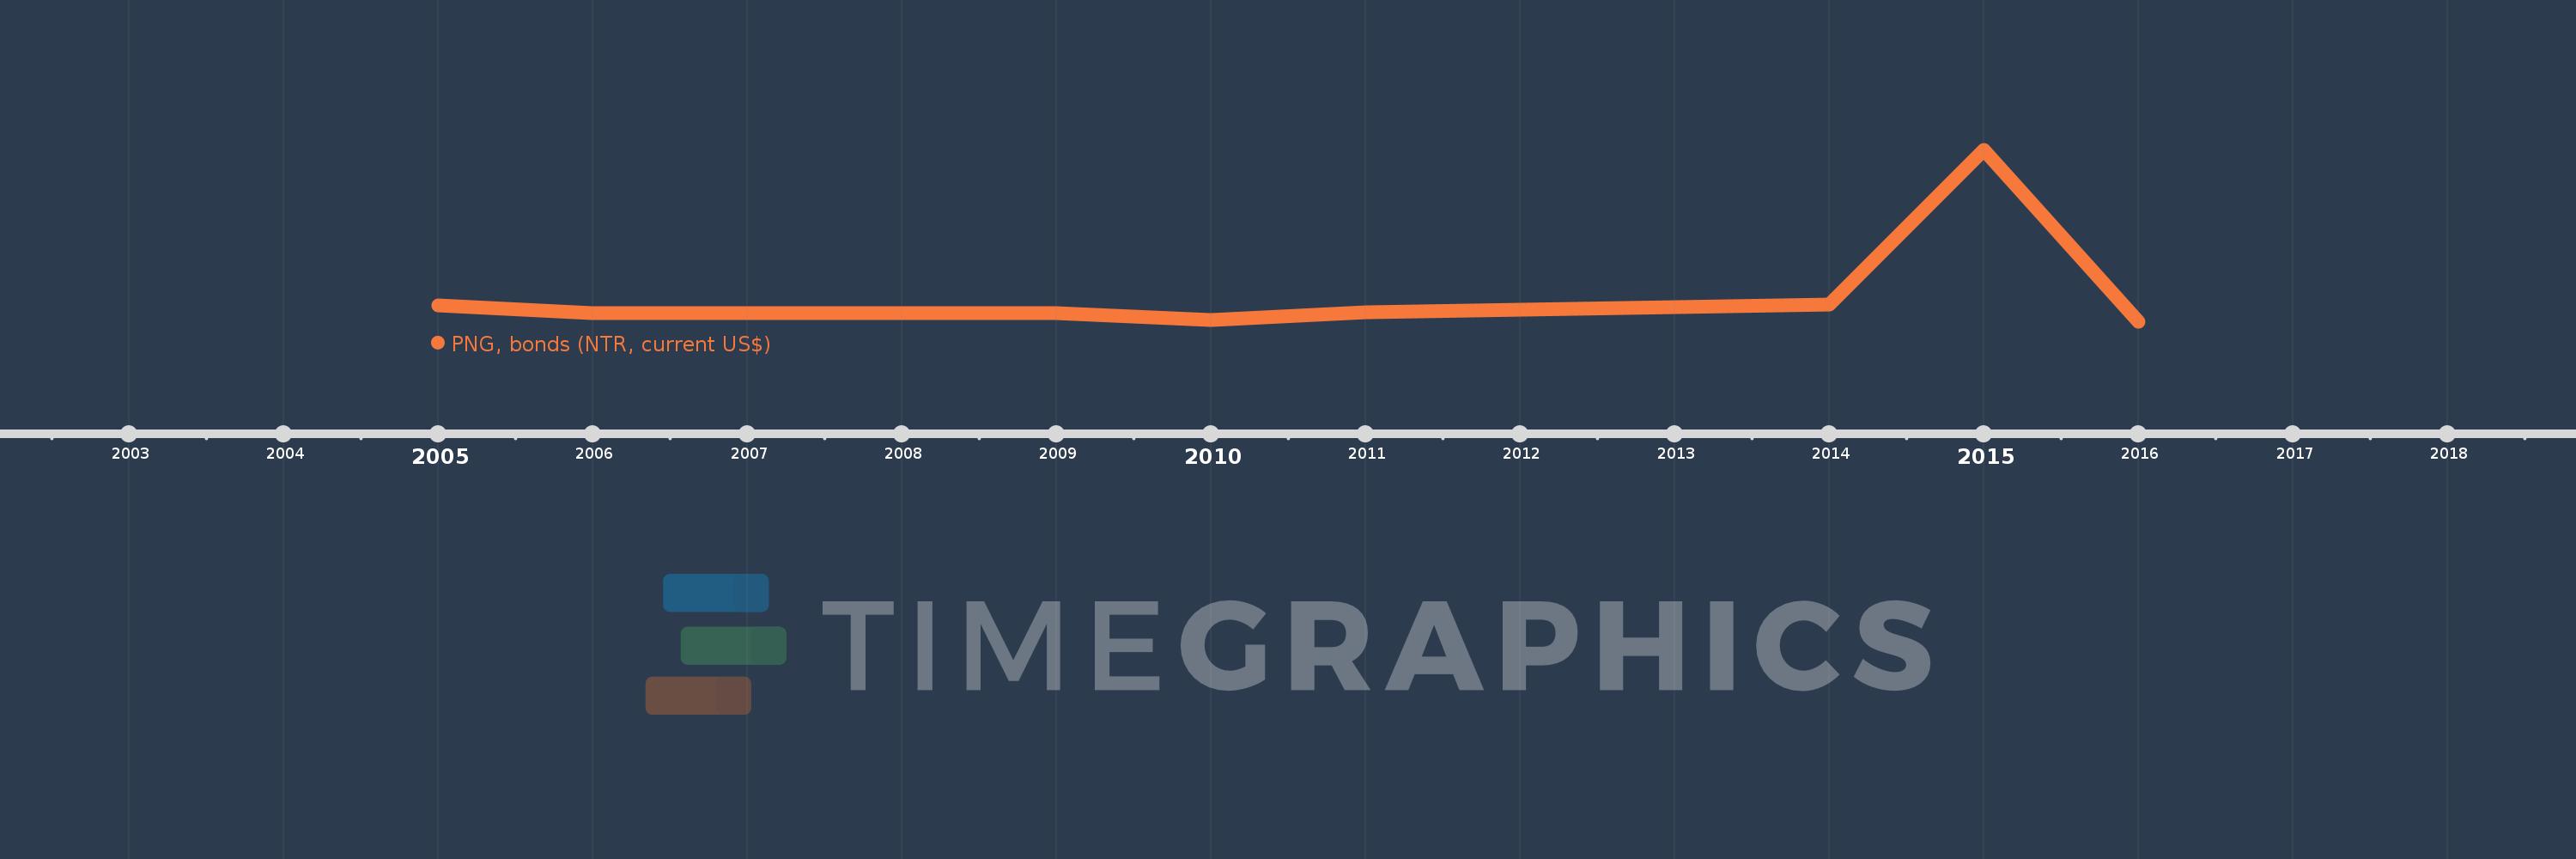
This timeline shows a graph from 2005 to 2016 of Sri Lanka. No data until 2004. Number of actual observations by date: 10.
Source name:
World Development Indicators
Source organization:
World Bank, International Debt Statistics.
Categories, topics:
External Debt
Last updated:
apr 23, 2017
Indicators value changes by year
Minimum:
-127.685 mln
jan 1, 2016
Maximum:
2.159 bln
jan 1, 2015
At the date of observation
Value
Absolute change
Change from the previous value
jan 1, 2005
93.126 mln
+93.126 mln
0.0%
jan 1, 2006
-6.874 mln
-100.0 mln
-107.38%
jan 1, 2007
-6.874 mln
0.0
0.0%
jan 1, 2008
-6.874 mln
0.0
0.0%
jan 1, 2009
-6.874 mln
0.0
0.0%
jan 1, 2010
-106.874 mln
-100.0 mln
1.45K%
jan 1, 2011
0.0
+106.874 mln
-100.0%
jan 1, 2014
100.0 mln
+100.0 mln
%
jan 1, 2015
2.159 bln
+2.059 bln
2.06K%
jan 1, 2016
-127.685 mln
-2.286 bln
-105.92%
Ranking of countries by current statistics by years
