30
/
AIzaSyAYiBZKx7MnpbEhh9jyipgxe19OcubqV5w
April 1, 2024
224075
Philippines
PHL
true
2
1
PNG, bonds (NTR, current US$)
2016,2015,2014,2013,2012,2011,2010,2009,2008,2007,2006,2005,2004,2003,2002,2001,2000,1999,1998,1997,1996,1995,1994,1993
Public Timelines
FAQ
Menu
Public Timelines
FAQ
Public Timelines
FAQ
For education
For educational institutions
For teachers
For students
Open cabinet
For educational institutions
For teachers
For students
Open cabinet
Create
Close
Create a timeline
Public timelines
Library
FAQ
Download
Global statistics library
→
Philippines
→
PNG, bonds (NTR, current US$)
This statistics in other country:
Argentina
Armenia
Botswana
Brazil
Bulgaria
China
Colombia
Costa Rica
Dominican Republic
East Asia & Pacific (excluding high income)
Ecuador
Egypt, Arab Rep.
El Salvador
Europe & Central Asia (excluding high income)
Georgia
Ghana
Guatemala
IDA only
India
Indonesia
Jamaica
Kazakhstan
Lao PDR
Latin America & Caribbean (excluding high income)
Lebanon
Low & middle income
Lower middle income
Malaysia
Mexico
Middle East & North Africa (excluding high income)
Middle income
Mongolia
Nigeria
Pakistan
Panama
Paraguay
Peru
Philippines
Romania
Russian Federation
Serbia
South Africa
South Asia
Sri Lanka
Sub-Saharan Africa (excluding high income)
Thailand
Turkey
Ukraine
Upper middle income
Venezuela, RB
Vietnam
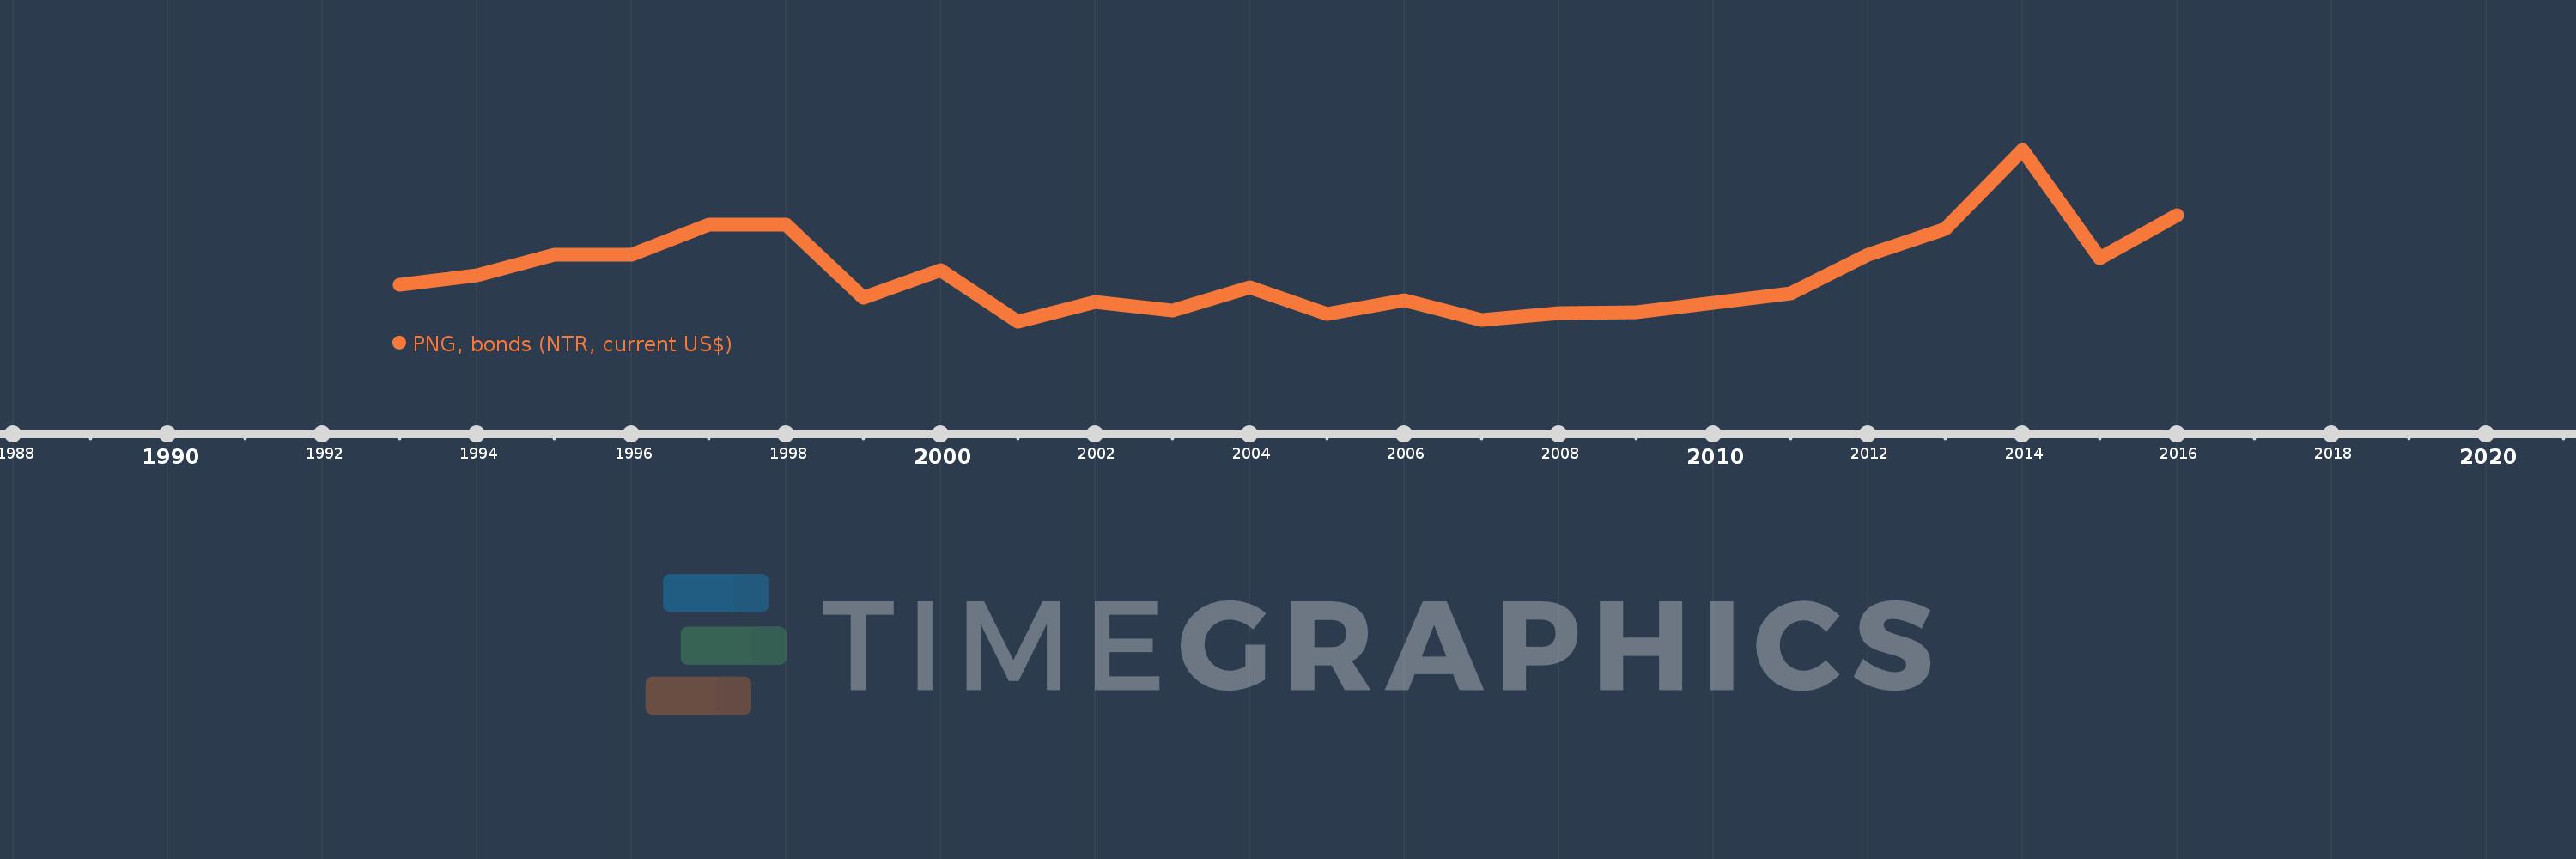
Timeline:
This timeline shows a graph from
1993
to
2016
of Philippines. No data until
1992
. Number of actual observations by date:
24
.
Source name:
World Development Indicators
Source organization:
World Bank, International Debt Statistics.
Categories, topics:
External Debt
Last updated:
apr 23, 2017
Indicators value changes by year
Meaning:
294.192 mln
Minimum:
-918.575 mln
jan 1, 2001
Maximum:
3.407 bln
jan 1, 2014
At the date of observation
Value
Absolute change
Change from the previous value
jan 1, 1993
20.0 mln
+20.0 mln
0.0%
jan 1, 1994
249.997 mln
+229.997 mln
1.15K%
jan 1, 1995
764.324 mln
+514.327 mln
205.73%
jan 1, 1996
781.992 mln
+17.668 mln
2.31%
jan 1, 1997
1.524 bln
+742.211 mln
94.91%
jan 1, 1998
1.536 bln
+12.045 mln
0.79%
jan 1, 1999
-296.321 mln
-1.833 bln
-119.29%
jan 1, 2000
387.508 mln
+683.829 mln
-230.77%
jan 1, 2001
-918.575 mln
-1.306 bln
-337.05%
jan 1, 2002
-414.262 mln
+504.313 mln
-54.9%
jan 1, 2003
-622.936 mln
-208.674 mln
50.37%
jan 1, 2004
-53.802 mln
+569.134 mln
-91.36%
jan 1, 2005
-720.948 mln
-667.146 mln
1.24K%
jan 1, 2006
-366.108 mln
+354.84 mln
-49.22%
jan 1, 2007
-858.337 mln
-492.229 mln
134.45%
jan 1, 2008
-697.777 mln
+160.56 mln
-18.71%
jan 1, 2009
-675.258 mln
+22.519 mln
-3.23%
jan 1, 2010
-427.031 mln
+248.227 mln
-36.76%
jan 1, 2011
-199.164 mln
+227.867 mln
-53.36%
jan 1, 2012
770.697 mln
+969.861 mln
-486.97%
jan 1, 2013
1.418 bln
+647.365 mln
84.0%
jan 1, 2014
3.407 bln
+1.989 bln
140.25%
jan 1, 2015
690.263 mln
-2.717 bln
-79.74%
jan 1, 2016
1.761 bln
+1.071 bln
155.12%
Ranking of countries by current statistics by years
About & Feedback
Terms
Privacy
Library
2024
©
Time.Graphics
Support 24/7
Cabinet
Get premium
Donate
The service accepts bank transfer (ACH, Wire) or cards (Visa, MasterCard, etc). Processed by Stripe.
Secured with SSL
Excellent (Trustpilot Reviews)
Based on 115+ reviews
Write your own review on
Trustpilot.com
