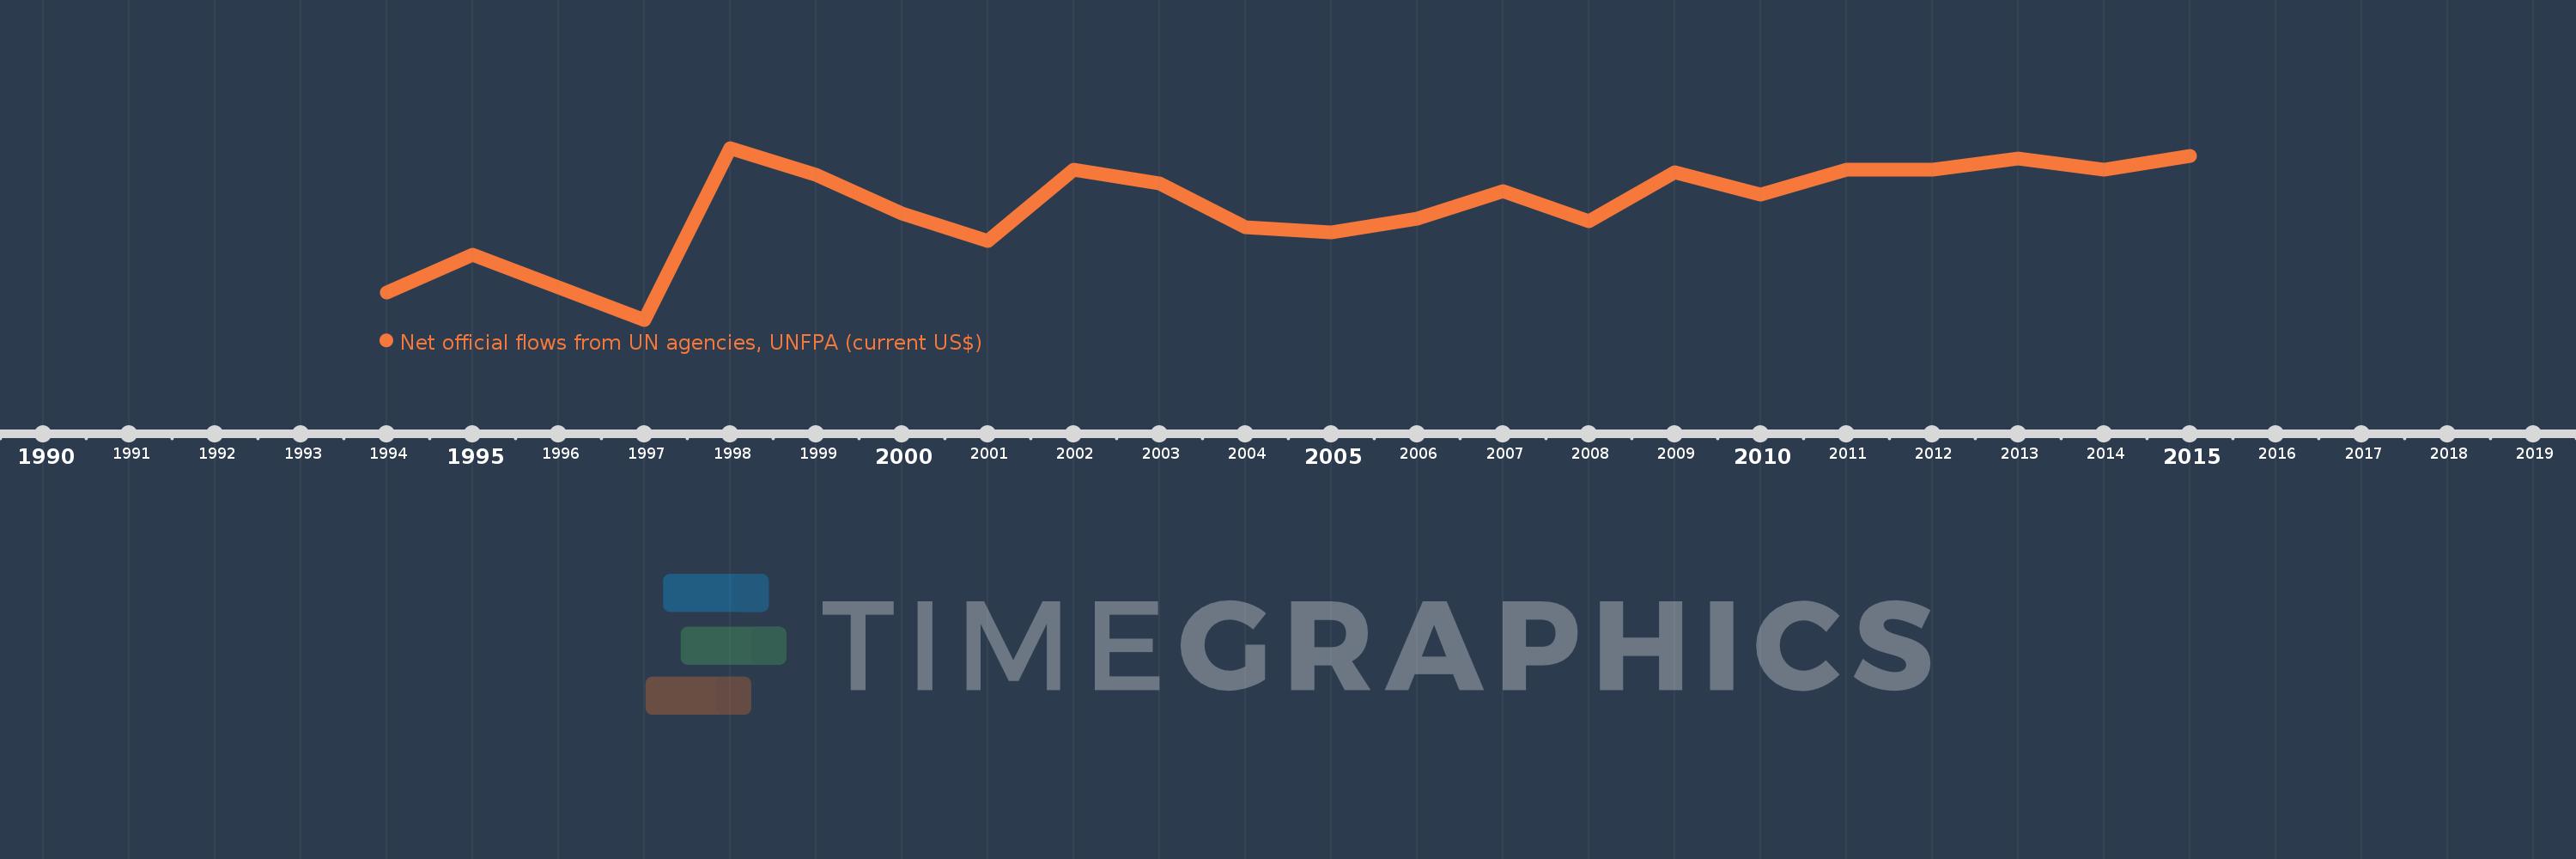
This timeline shows a graph from 1994 to 2015 of Turkmenistan. No data until 1993. Number of actual observations by date: 22.
Source name:
World Development Indicators
Source organization:
Development Assistance Committee of the Organisation for Economic Co-operation and Development, Geographical Distribution of Financial Flows to Developing Countries, Development Co-operation Report, and International Development Statistics database. Data are available online at: www.oecd.org/dac/stats/idsonline.
Categories, topics:
Aid Effectiveness
Last updated:
apr 23, 2017
Indicators value changes by year
Meaning:
551.364K
Minimum:
140.0K
jan 1, 1997
Maximum:
770.0K
jan 1, 1998
At the date of observation
Value
Absolute change
Change from the previous value
jan 1, 1994
240.0K
+240.0K
0.0%
jan 1, 1995
380.0K
+140.0K
58.33%
jan 1, 1996
260.0K
-120.0K
-31.58%
jan 1, 1997
140.0K
-120.0K
-46.15%
jan 1, 1998
770.0K
+630.0K
450.0%
jan 1, 1999
670.0K
-100.0K
-12.99%
jan 1, 2000
530.0K
-140.0K
-20.9%
jan 1, 2001
430.0K
-100.0K
-18.87%
jan 1, 2002
690.0K
+260.0K
60.47%
jan 1, 2003
640.0K
-50.0K
-7.25%
jan 1, 2004
480.0K
-160.0K
-25.0%
jan 1, 2005
460.0K
-20.0K
-4.17%
jan 1, 2006
510.0K
+50.0K
10.87%
jan 1, 2007
610.0K
+100.0K
19.61%
jan 1, 2008
500.0K
-110.0K
-18.03%
jan 1, 2009
680.0K
+180.0K
36.0%
jan 1, 2010
600.0K
-80.0K
-11.76%
jan 1, 2011
690.0K
+90.0K
15.0%
jan 1, 2012
690.0K
0.0
0.0%
jan 1, 2013
730.0K
+40.0K
5.8%
jan 1, 2014
690.0K
-40.0K
-5.48%
jan 1, 2015
740.0K
+50.0K
7.25%
Ranking of countries by current statistics by years
