29
/
en
AIzaSyAYiBZKx7MnpbEhh9jyipgxe19OcubqV5w
April 1, 2024
203316
Mozambique
MOZ
true
2
1
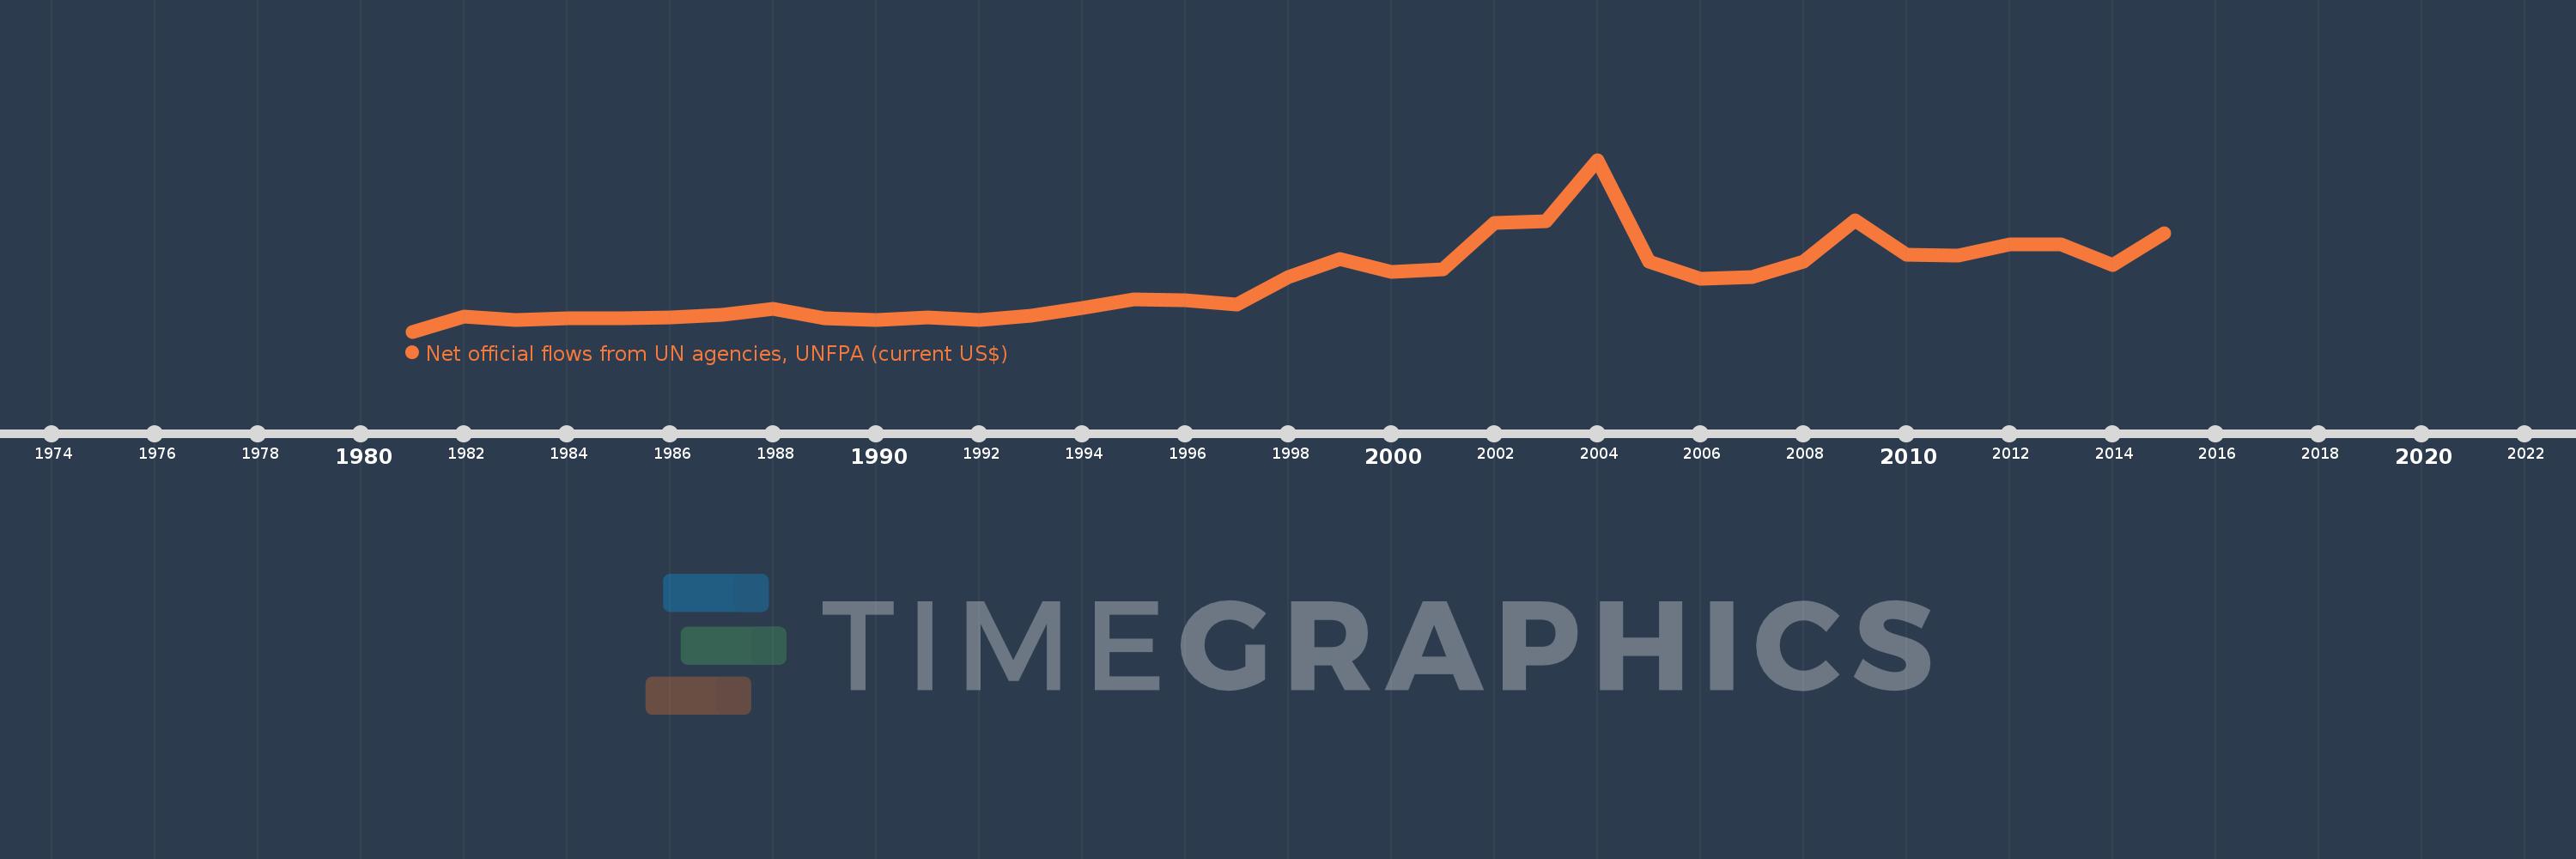
Net official flows from UN agencies, UNFPA (current US$)
2015,2014,2013,2012,2011,2010,2009,2008,2007,2006,2005,2004,2003,2002,2001,2000,1999,1998,1997,1996,1995,1994,1993,1992,1991,1990,1989,1988,1987,1986,1985,1984,1983,1982,1981
This statistics in other country:
AfghanistanAlbaniaAlgeriaAngolaAntigua and BarbudaArab WorldArgentinaArmeniaAzerbaijanBahamas, TheBahrainBangladeshBarbadosBelarusBelizeBeninBermudaBhutanBoliviaBosnia and HerzegovinaBotswanaBrazilBritish Virgin IslandsBulgariaBurkina FasoBurundiCabo VerdeCambodiaCameroonCaribbean small statesCayman IslandsCentral African RepublicCentral Europe and the BalticsChadChileChinaColombiaComorosCongo, Dem. Rep.Congo, Rep.Costa RicaCote d'IvoireCroatiaCubaCyprusDjiboutiDominicaDominican RepublicEast Asia & PacificEast Asia & Pacific (excluding high income)East Asia & Pacific (IDA & IBRD countries)EcuadorEgypt, Arab Rep.El SalvadorEquatorial GuineaEritreaEstoniaEthiopiaEuro areaEurope & Central AsiaEurope & Central Asia (excluding high income)Europe & Central Asia (IDA & IBRD countries)European UnionFijiFragile and conflict affected situationsGabonGambia, TheGeorgiaGhanaGrenadaGuatemalaGuineaGuinea-BissauGuyanaHaitiHeavily indebted poor countries (HIPC)High incomeHondurasHong Kong SAR, ChinaHungaryIBRD onlyIDA & IBRD totalIDA blendIDA onlyIDA totalIndiaIndonesiaIran, Islamic Rep.IraqJamaicaJordanKazakhstanKenyaKiribatiKorea, Dem. People’s Rep.Korea, Rep.KosovoKuwaitKyrgyz RepublicLao PDRLatin America & Caribbean Latin America & Caribbean (excluding high income)Latin America & the Caribbean (IDA & IBRD countries)LatviaLeast developed countries: UN classificationLebanonLesothoLiberiaLibyaLithuaniaLow & middle incomeLow incomeLower middle incomeMacedonia, FYRMadagascarMalawiMalaysiaMaldivesMaliMaltaMarshall IslandsMauritaniaMauritiusMexicoMicronesia, Fed. Sts.Middle East & North AfricaMiddle East & North Africa (excluding high income)Middle East & North Africa (IDA & IBRD countries)Middle incomeMoldovaMongoliaMontenegroMoroccoMozambiqueMyanmarNamibiaNepalNicaraguaNigerNigeriaNorth AmericaNorthern Mariana IslandsOECD membersOmanOther small statesPacific island small statesPakistanPalauPanamaPapua New GuineaParaguayPeruPhilippinesPolandQatarRomaniaRussian FederationRwandaSamoaSao Tome and PrincipeSaudi ArabiaSenegalSerbiaSeychellesSierra LeoneSingaporeSmall statesSolomon IslandsSomaliaSouth AfricaSouth AsiaSouth Asia (IDA & IBRD)South SudanSri LankaSt. Kitts and NevisSt. LuciaSt. Vincent and the GrenadinesSub-Saharan Africa Sub-Saharan Africa (excluding high income)Sub-Saharan Africa (IDA & IBRD countries)SudanSurinameSwazilandSyrian Arab RepublicTajikistanTanzaniaThailandTimor-LesteTogoTongaTrinidad and TobagoTunisiaTurkeyTurkmenistanTurks and Caicos IslandsTuvaluUgandaUkraineUnited Arab EmiratesUpper middle incomeUruguayUzbekistanVanuatuVenezuela, RBVietnamWest Bank and GazaWorldYemen, Rep.ZambiaZimbabwe Timeline:
This timeline shows a graph from 1981 to 2015 of Mozambique. No data until 1980. Number of actual observations by date: 35.
Source name:
World Development Indicators
Source organization:
Development Assistance Committee of the Organisation for Economic Co-operation and Development, Geographical Distribution of Financial Flows to Developing Countries, Development Co-operation Report, and International Development Statistics database. Data are available online at: www.oecd.org/dac/stats/idsonline.
Categories, topics:
Aid Effectiveness
Last updated:
apr 23, 2017
Indicators value changes by year
Minimum:
210.0K
jan 1, 1981
Maximum:
9.04 mln
jan 1, 2004
At the date of observation
Value
Absolute change
Change from previous value
jan 1, 1981
210.0K
+210.0K
0.0%
jan 1, 1982
970.0K
+760.0K
361.9%
jan 1, 1983
820.0K
-150.0K
-15.46%
jan 1, 1984
900.0K
+80.0K
9.76%
jan 1, 1985
900.0K
0.0
0.0%
jan 1, 1986
920.0K
+20.0K
2.22%
jan 1, 1987
1.08 mln
+160.0K
17.39%
jan 1, 1988
1.36 mln
+280.0K
25.93%
jan 1, 1989
880.0K
-480.0K
-35.29%
jan 1, 1990
820.0K
-60.0K
-6.82%
jan 1, 1991
960.0K
+140.0K
17.07%
jan 1, 1992
820.0K
-140.0K
-14.58%
jan 1, 1993
1.01 mln
+190.0K
23.17%
jan 1, 1994
1.44 mln
+430.0K
42.57%
jan 1, 1995
1.88 mln
+440.0K
30.56%
jan 1, 1996
1.84 mln
-40.0K
-2.13%
jan 1, 1997
1.61 mln
-230.0K
-12.5%
jan 1, 1998
3.03 mln
+1.42 mln
88.2%
jan 1, 1999
3.94 mln
+910.0K
30.03%
jan 1, 2000
3.27 mln
-670.0K
-17.01%
jan 1, 2001
3.41 mln
+140.0K
4.28%
jan 1, 2002
5.78 mln
+2.37 mln
69.5%
jan 1, 2003
5.87 mln
+90.0K
1.56%
jan 1, 2004
9.04 mln
+3.17 mln
54.0%
jan 1, 2005
3.81 mln
-5.23 mln
-57.85%
jan 1, 2006
2.94 mln
-870.0K
-22.83%
jan 1, 2007
3.02 mln
+80.0K
2.72%
jan 1, 2008
3.8 mln
+780.0K
25.83%
jan 1, 2009
5.94 mln
+2.14 mln
56.32%
jan 1, 2010
4.17 mln
-1.77 mln
-29.8%
jan 1, 2011
4.12 mln
-50.0K
-1.2%
jan 1, 2012
4.7 mln
+580.0K
14.08%
jan 1, 2013
4.67 mln
-30.0K
-0.64%
jan 1, 2014
3.63 mln
-1.04 mln
-22.27%
jan 1, 2015
5.25 mln
+1.62 mln
44.63%
Ranking of countries by current statistics by years


Comments: