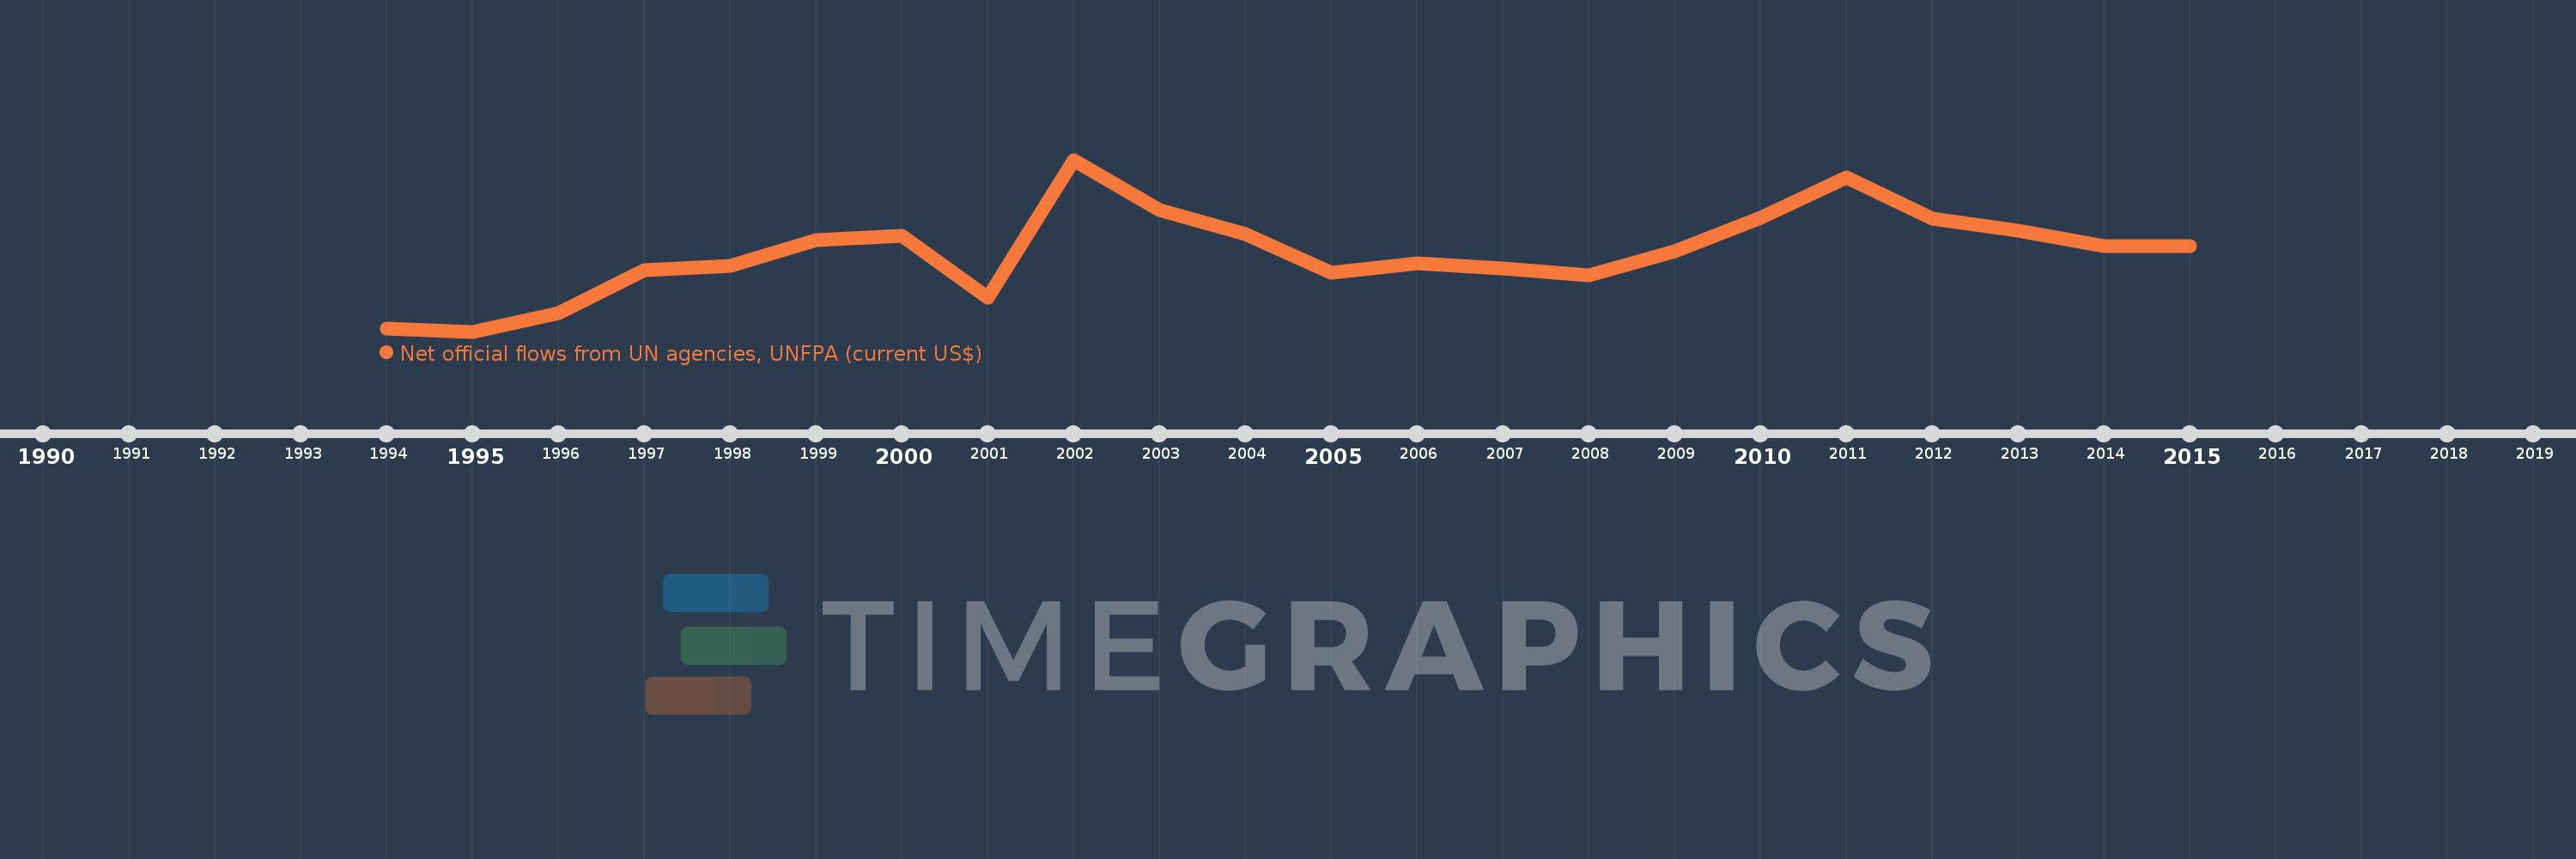
This timeline shows a graph from 1994 to 2015 of Eritrea. No data until 1993. Number of actual observations by date: 22.
Source name:
World Development Indicators
Source organization:
Development Assistance Committee of the Organisation for Economic Co-operation and Development, Geographical Distribution of Financial Flows to Developing Countries, Development Co-operation Report, and International Development Statistics database. Data are available online at: www.oecd.org/dac/stats/idsonline.
Categories, topics:
Aid Effectiveness
Last updated:
apr 23, 2017
Indicators value changes by year
Meaning:
1.318 mln
Minimum:
130.0K
jan 1, 1995
Maximum:
2.71 mln
jan 1, 2002
At the date of observation
Value
Absolute change
Change from the previous value
jan 1, 1994
180.0K
+180.0K
0.0%
jan 1, 1995
130.0K
-50.0K
-27.78%
jan 1, 1996
410.0K
+280.0K
215.38%
jan 1, 1997
1.05 mln
+640.0K
156.1%
jan 1, 1998
1.12 mln
+70.0K
6.67%
jan 1, 1999
1.5 mln
+380.0K
33.93%
jan 1, 2000
1.57 mln
+70.0K
4.67%
jan 1, 2001
640.0K
-930.0K
-59.24%
jan 1, 2002
2.71 mln
+2.07 mln
323.44%
jan 1, 2003
1.96 mln
-750.0K
-27.68%
jan 1, 2004
1.59 mln
-370.0K
-18.88%
jan 1, 2005
1.02 mln
-570.0K
-35.85%
jan 1, 2006
1.16 mln
+140.0K
13.73%
jan 1, 2007
1.08 mln
-80.0K
-6.9%
jan 1, 2008
980.0K
-100.0K
-9.26%
jan 1, 2009
1.33 mln
+350.0K
35.71%
jan 1, 2010
1.84 mln
+510.0K
38.35%
jan 1, 2011
2.44 mln
+600.0K
32.61%
jan 1, 2012
1.83 mln
-610.0K
-25.0%
jan 1, 2013
1.64 mln
-190.0K
-10.38%
jan 1, 2014
1.41 mln
-230.0K
-14.02%
jan 1, 2015
1.41 mln
0.0
0.0%
Ranking of countries by current statistics by years
