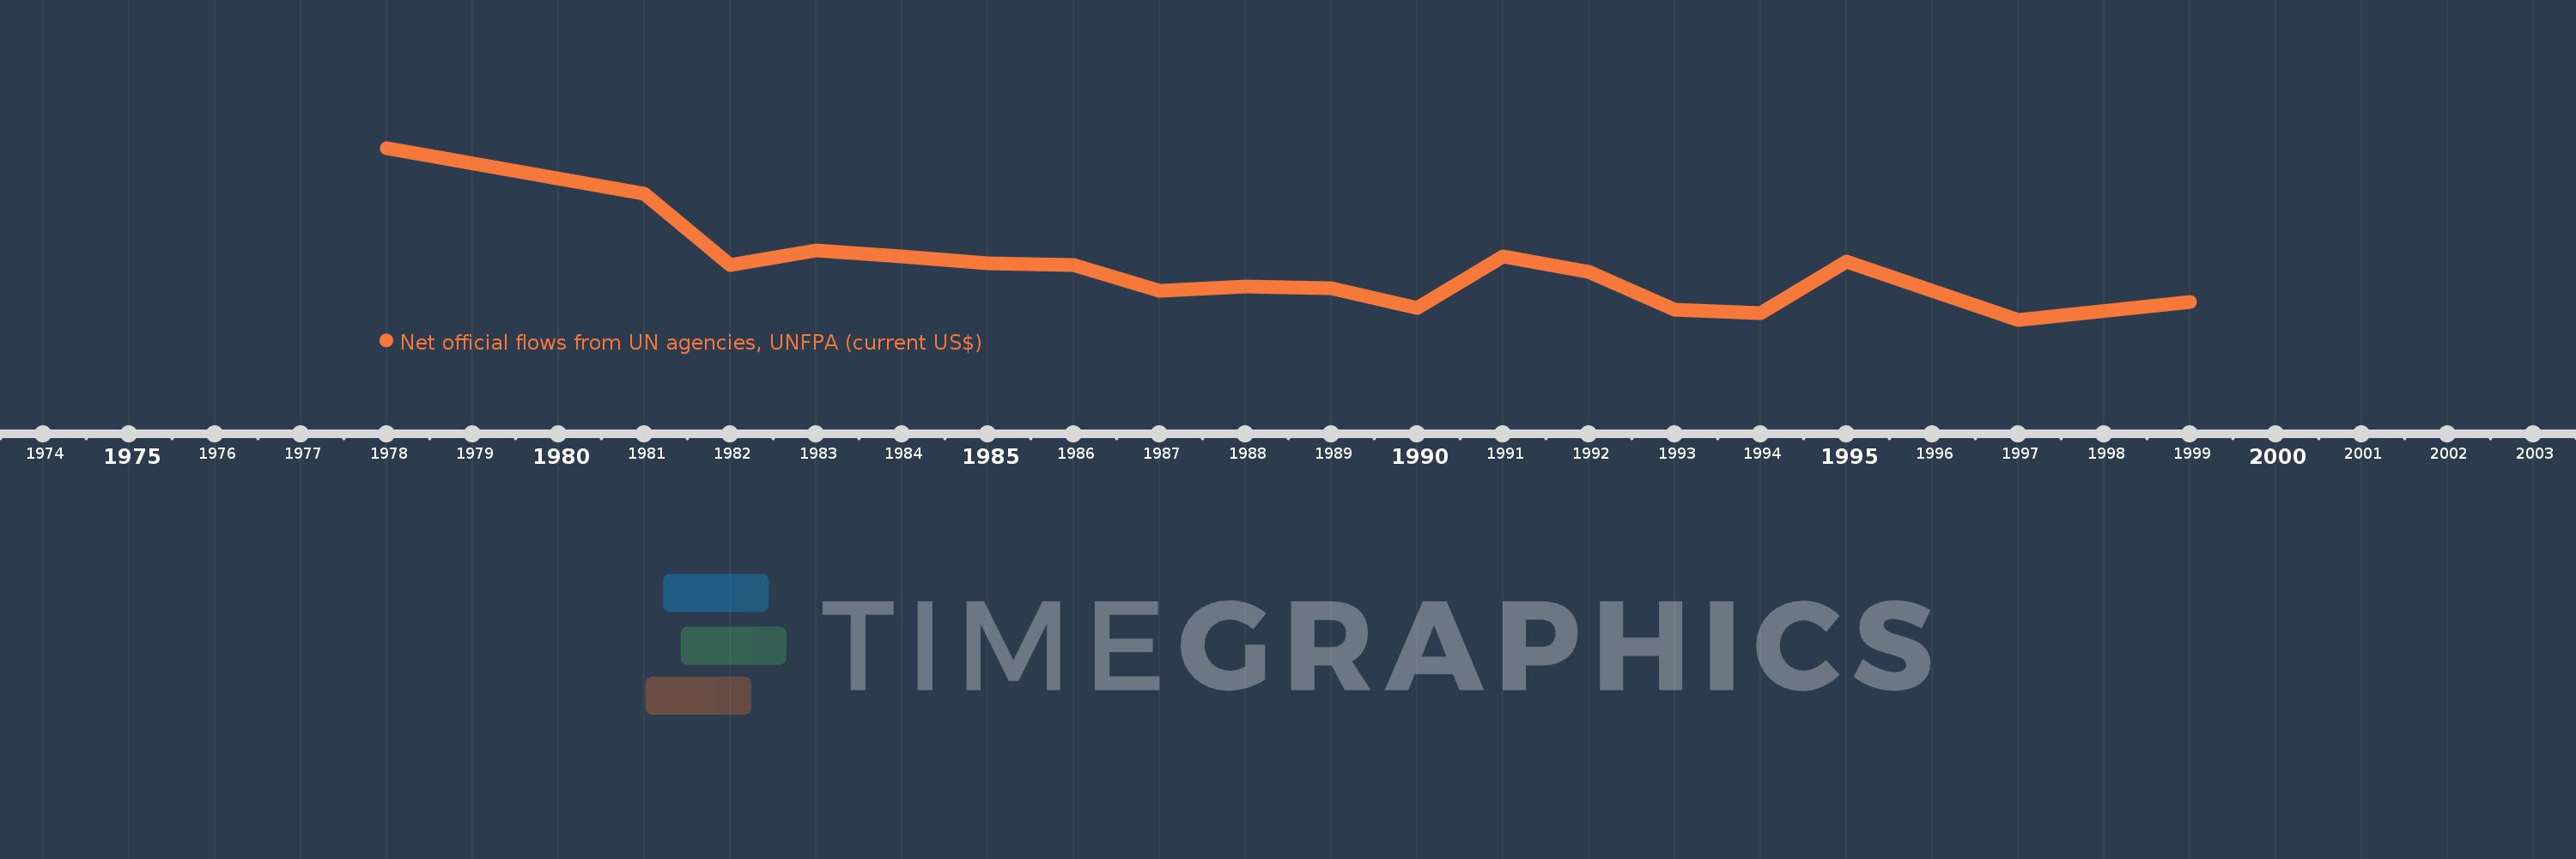
This timeline shows a graph from 1978 to 1999 of Korea, Rep.. No data until 1977. Number of actual observations by date: 18.
Source name:
World Development Indicators
Source organization:
Development Assistance Committee of the Organisation for Economic Co-operation and Development, Geographical Distribution of Financial Flows to Developing Countries, Development Co-operation Report, and International Development Statistics database. Data are available online at: www.oecd.org/dac/stats/idsonline.
Categories, topics:
Aid Effectiveness
Last updated:
apr 23, 2017
Indicators value changes by year
Meaning:
407.778K
Minimum:
10.0K
jan 1, 1997
Maximum:
1.37 mln
jan 1, 1978
At the date of observation
Value
Absolute change
Change from the previous value
jan 1, 1978
1.37 mln
+1.37 mln
0.0%
jan 1, 1981
1.01 mln
-360.0K
-26.28%
jan 1, 1982
440.0K
-570.0K
-56.44%
jan 1, 1983
560.0K
+120.0K
27.27%
jan 1, 1984
510.0K
-50.0K
-8.93%
jan 1, 1985
460.0K
-50.0K
-9.8%
jan 1, 1986
440.0K
-20.0K
-4.35%
jan 1, 1987
240.0K
-200.0K
-45.45%
jan 1, 1988
270.0K
+30.0K
12.5%
jan 1, 1989
260.0K
-10.0K
-3.7%
jan 1, 1990
100.0K
-160.0K
-61.54%
jan 1, 1991
510.0K
+410.0K
410.0%
jan 1, 1992
390.0K
-120.0K
-23.53%
jan 1, 1993
90.0K
-300.0K
-76.92%
jan 1, 1994
60.0K
-30.0K
-33.33%
jan 1, 1995
470.0K
+410.0K
683.33%
jan 1, 1997
10.0K
-460.0K
-97.87%
jan 1, 1999
150.0K
+140.0K
1.4K%
Ranking of countries by current statistics by years
