29
/
en
AIzaSyAYiBZKx7MnpbEhh9jyipgxe19OcubqV5w
April 1, 2024
248052
Spain
ESP
true
2
1
Services, etc., value added (current LCU)
2016,2015,2014,2013,2012,2011,2010,2009,2008,2007,2006,2005,2004,2003,2002,2001,2000,1999,1998,1997,1996
This statistics in other country:
AfghanistanAlbaniaAlgeriaAndorraAngolaAntigua and BarbudaArgentinaArmeniaArubaAustraliaAustriaAzerbaijanBahamas, TheBahrainBangladeshBarbadosBelarusBelgiumBelizeBeninBermudaBhutanBoliviaBosnia and HerzegovinaBotswanaBrazilBrunei DarussalamBulgariaBurkina FasoBurundiCabo VerdeCambodiaCameroonCanadaCentral African RepublicChadChileChinaColombiaComorosCongo, Dem. Rep.Congo, Rep.Costa RicaCote d'IvoireCroatiaCubaCyprusCzech RepublicDenmarkDjiboutiDominicaDominican RepublicEcuadorEgypt, Arab Rep.El SalvadorEquatorial GuineaEritreaEstoniaEthiopiaFaroe IslandsFijiFinlandFranceGabonGambia, TheGeorgiaGermanyGhanaGreeceGrenadaGuatemalaGuineaGuinea-BissauGuyanaHondurasHong Kong SAR, ChinaHungaryIcelandIndiaIndonesiaIran, Islamic Rep.IraqIrelandItalyJamaicaJapanJordanKazakhstanKenyaKiribatiKorea, Rep.KosovoKuwaitKyrgyz RepublicLao PDRLatviaLebanonLesothoLiberiaLibyaLithuaniaLuxembourgMacao SAR, ChinaMacedonia, FYRMadagascarMalawiMalaysiaMaldivesMaliMaltaMarshall IslandsMauritaniaMauritiusMexicoMicronesia, Fed. Sts.MoldovaMongoliaMontenegroMoroccoMozambiqueMyanmarNamibiaNepalNetherlandsNew CaledoniaNew ZealandNicaraguaNigerNigeriaNorwayOmanPakistanPalauPanamaPapua New GuineaParaguayPeruPhilippinesPolandPortugalPuerto RicoQatarRomaniaRussian FederationRwandaSamoaSao Tome and PrincipeSaudi ArabiaSenegalSerbiaSeychellesSierra LeoneSingaporeSlovak RepublicSloveniaSolomon IslandsSomaliaSouth AfricaSpainSri LankaSt. Kitts and NevisSt. LuciaSt. Vincent and the GrenadinesSudanSurinameSwazilandSwedenSwitzerlandSyrian Arab RepublicTajikistanTanzaniaThailandTimor-LesteTogoTongaTrinidad and TobagoTunisiaTurkeyTurkmenistanTuvaluUgandaUkraineUnited Arab EmiratesUnited KingdomUnited StatesUruguayUzbekistanVanuatuVenezuela, RBVietnamWest Bank and GazaYemen, Rep.ZambiaZimbabwe Timeline:
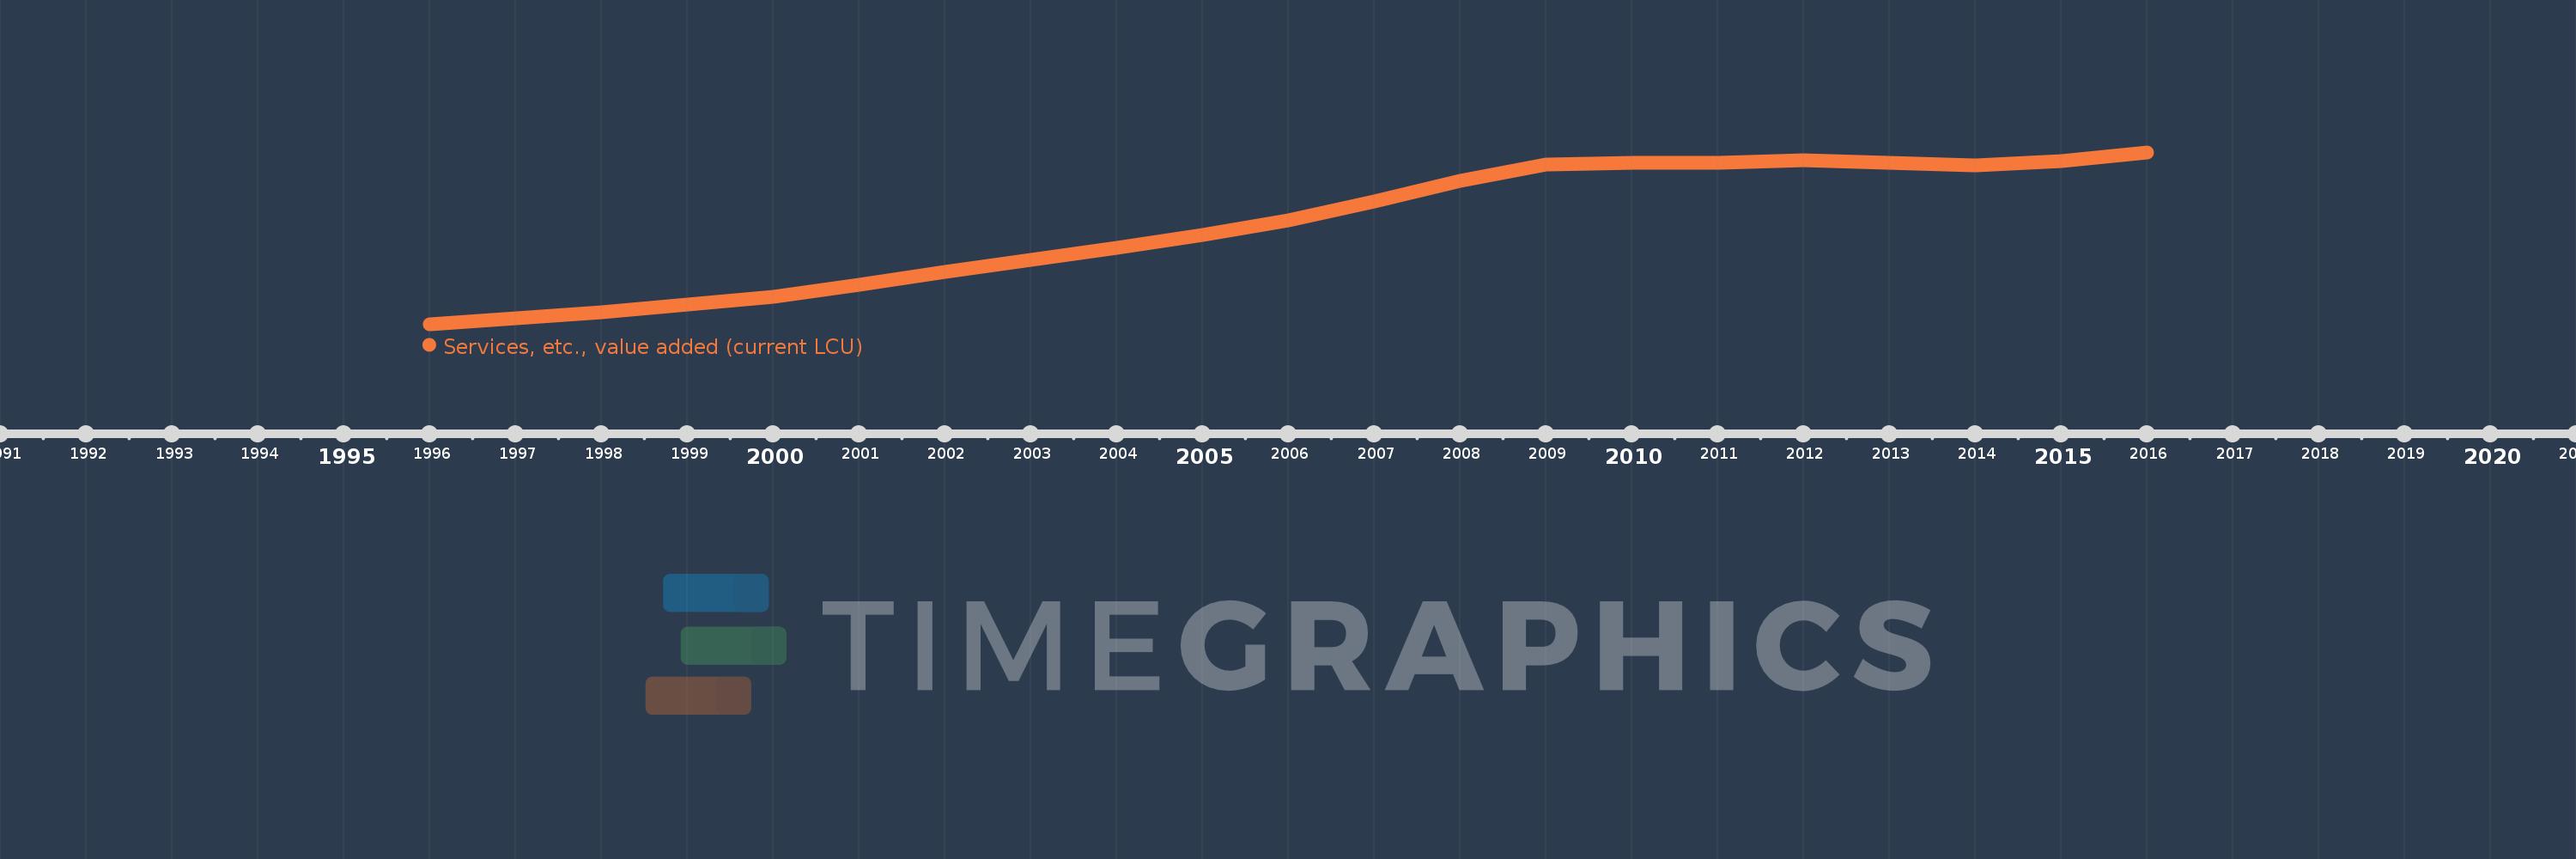
This timeline shows a graph from 1996 to 2016 of Spain. No data until 1995. Number of actual observations by date: 21.
Source name:
World Development Indicators
Source organization:
World Bank national accounts data, and OECD National Accounts data files.
Categories, topics:
Economy & Growth
Last updated:
apr 23, 2017
Indicators value changes by year
Minimum:
276.621 bln
jan 1, 1996
Maximum:
735.603 bln
jan 1, 2016
At the date of observation
Value
Absolute change
Change from previous value
jan 1, 1996
276.621 bln
+276.621 bln
0.0%
jan 1, 1997
291.542 bln
+14.921 bln
5.39%
jan 1, 1998
307.842 bln
+16.3 bln
5.59%
jan 1, 1999
328.276 bln
+20.434 bln
6.64%
jan 1, 2000
350.728 bln
+22.452 bln
6.84%
jan 1, 2001
381.954 bln
+31.226 bln
8.9%
jan 1, 2002
416.147 bln
+34.193 bln
8.95%
jan 1, 2003
448.398 bln
+32.251 bln
7.75%
jan 1, 2004
479.845 bln
+31.447 bln
7.01%
jan 1, 2005
516.198 bln
+36.353 bln
7.58%
jan 1, 2006
555.109 bln
+38.911 bln
7.54%
jan 1, 2007
603.638 bln
+48.529 bln
8.74%
jan 1, 2008
660.382 bln
+56.744 bln
9.4%
jan 1, 2009
703.051 bln
+42.669 bln
6.46%
jan 1, 2010
708.605 bln
+5.554 bln
0.79%
jan 1, 2011
707.156 bln
-1.449 bln
-0.2%
jan 1, 2012
713.699 bln
+6.543 bln
0.93%
jan 1, 2013
708.199 bln
-5.5 bln
-0.77%
jan 1, 2014
701.241 bln
-6.958 bln
-0.98%
jan 1, 2015
711.887 bln
+10.646 bln
1.52%
jan 1, 2016
735.603 bln
+23.716 bln
3.33%
Ranking of countries by current statistics by years


Comments: