29
/
en
AIzaSyAYiBZKx7MnpbEhh9jyipgxe19OcubqV5w
April 1, 2024
166858
Kazakhstan
KAZ
true
2
1
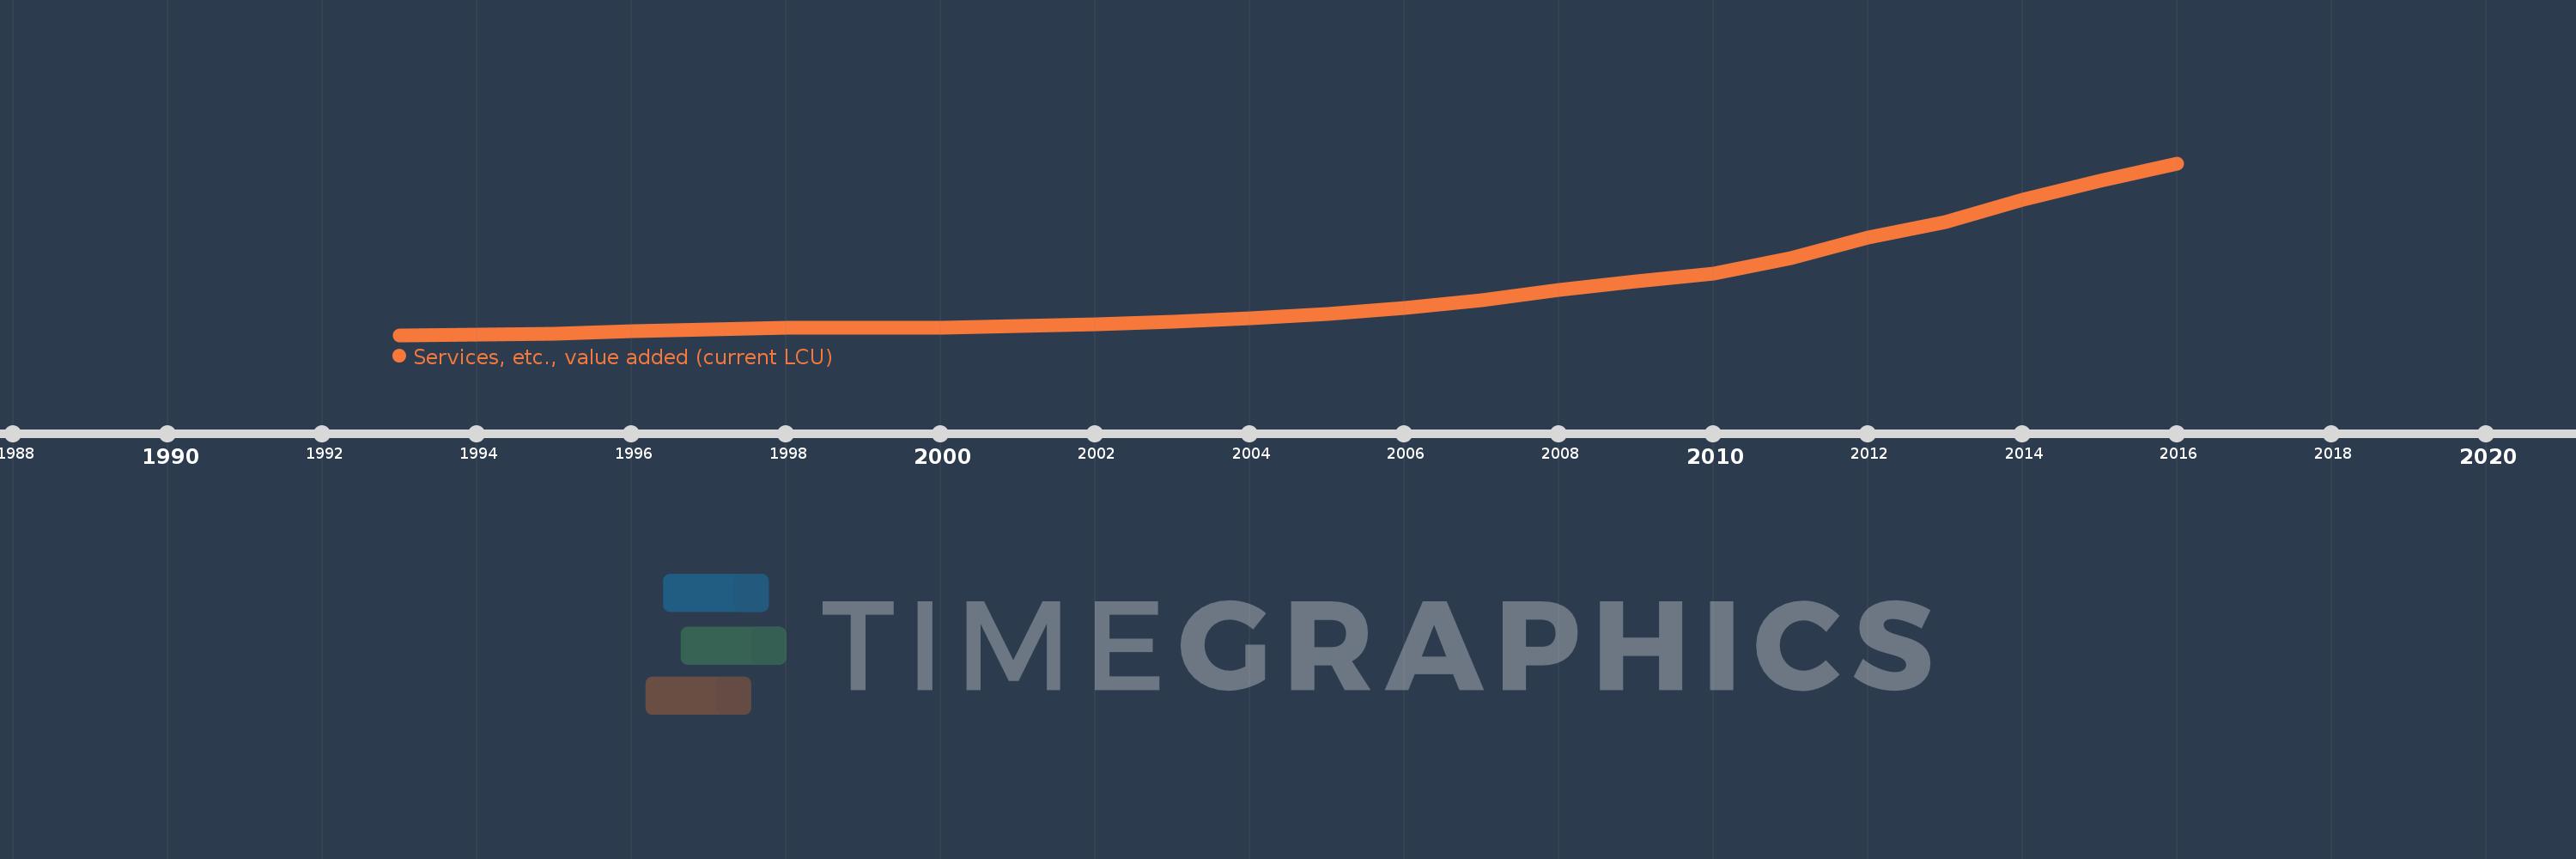
Services, etc., value added (current LCU)
2016,2015,2014,2013,2012,2011,2010,2009,2008,2007,2006,2005,2004,2003,2002,2001,2000,1999,1998,1997,1996,1995,1994,1993
This statistics in other country:
AfghanistanAlbaniaAlgeriaAndorraAngolaAntigua and BarbudaArgentinaArmeniaArubaAustraliaAustriaAzerbaijanBahamas, TheBahrainBangladeshBarbadosBelarusBelgiumBelizeBeninBermudaBhutanBoliviaBosnia and HerzegovinaBotswanaBrazilBrunei DarussalamBulgariaBurkina FasoBurundiCabo VerdeCambodiaCameroonCanadaCentral African RepublicChadChileChinaColombiaComorosCongo, Dem. Rep.Congo, Rep.Costa RicaCote d'IvoireCroatiaCubaCyprusCzech RepublicDenmarkDjiboutiDominicaDominican RepublicEcuadorEgypt, Arab Rep.El SalvadorEquatorial GuineaEritreaEstoniaEthiopiaFaroe IslandsFijiFinlandFranceGabonGambia, TheGeorgiaGermanyGhanaGreeceGrenadaGuatemalaGuineaGuinea-BissauGuyanaHondurasHong Kong SAR, ChinaHungaryIcelandIndiaIndonesiaIran, Islamic Rep.IraqIrelandItalyJamaicaJapanJordanKazakhstanKenyaKiribatiKorea, Rep.KosovoKuwaitKyrgyz RepublicLao PDRLatviaLebanonLesothoLiberiaLibyaLithuaniaLuxembourgMacao SAR, ChinaMacedonia, FYRMadagascarMalawiMalaysiaMaldivesMaliMaltaMarshall IslandsMauritaniaMauritiusMexicoMicronesia, Fed. Sts.MoldovaMongoliaMontenegroMoroccoMozambiqueMyanmarNamibiaNepalNetherlandsNew CaledoniaNew ZealandNicaraguaNigerNigeriaNorwayOmanPakistanPalauPanamaPapua New GuineaParaguayPeruPhilippinesPolandPortugalPuerto RicoQatarRomaniaRussian FederationRwandaSamoaSao Tome and PrincipeSaudi ArabiaSenegalSerbiaSeychellesSierra LeoneSingaporeSlovak RepublicSloveniaSolomon IslandsSomaliaSouth AfricaSpainSri LankaSt. Kitts and NevisSt. LuciaSt. Vincent and the GrenadinesSudanSurinameSwazilandSwedenSwitzerlandSyrian Arab RepublicTajikistanTanzaniaThailandTimor-LesteTogoTongaTrinidad and TobagoTunisiaTurkeyTurkmenistanTuvaluUgandaUkraineUnited Arab EmiratesUnited KingdomUnited StatesUruguayUzbekistanVanuatuVenezuela, RBVietnamWest Bank and GazaYemen, Rep.ZambiaZimbabwe Timeline:
This timeline shows a graph from 1993 to 2016 of Kazakhstan. No data until 1992. Number of actual observations by date: 24.
Source name:
World Development Indicators
Source organization:
World Bank national accounts data, and OECD National Accounts data files.
Categories, topics:
Economy & Growth
Last updated:
apr 23, 2017
Indicators value changes by year
Minimum:
605.0 mln
jan 1, 1993
Maximum:
24.243 trl
jan 1, 2016
At the date of observation
Value
Absolute change
Change from previous value
jan 1, 1993
605.0 mln
+605.0 mln
0.0%
jan 1, 1994
11.906 bln
+11.301 bln
1.87K%
jan 1, 1995
182.455 bln
+170.549 bln
1.43K%
jan 1, 1996
540.579 bln
+358.124 bln
196.28%
jan 1, 1997
811.038 bln
+270.459 bln
50.03%
jan 1, 1998
976.345 bln
+165.306 bln
20.38%
jan 1, 1999
973.025 bln
-3.32 bln
-0.34%
jan 1, 2000
1.039 trl
+65.791 bln
6.76%
jan 1, 2001
1.234 trl
+195.396 bln
18.81%
jan 1, 2002
1.568 trl
+333.322 bln
27.01%
jan 1, 2003
1.85 trl
+282.694 bln
18.03%
jan 1, 2004
2.319 trl
+468.459 bln
25.32%
jan 1, 2005
3.023 trl
+704.796 bln
30.4%
jan 1, 2006
3.783 trl
+759.586 bln
25.12%
jan 1, 2007
4.967 trl
+1.184 trl
31.29%
jan 1, 2008
6.355 trl
+1.388 trl
27.94%
jan 1, 2009
7.613 trl
+1.258 trl
19.8%
jan 1, 2010
8.644 trl
+1.031 trl
13.54%
jan 1, 2011
10.807 trl
+2.164 trl
25.03%
jan 1, 2012
13.808 trl
+3.0 trl
27.76%
jan 1, 2013
15.939 trl
+2.131 trl
15.43%
jan 1, 2014
19.144 trl
+3.205 trl
20.11%
jan 1, 2015
21.758 trl
+2.614 trl
13.65%
jan 1, 2016
24.243 trl
+2.486 trl
11.42%
Ranking of countries by current statistics by years


Comments: