29
/
en
AIzaSyAYiBZKx7MnpbEhh9jyipgxe19OcubqV5w
April 1, 2024
279338
Uzbekistan
UZB
true
2
1
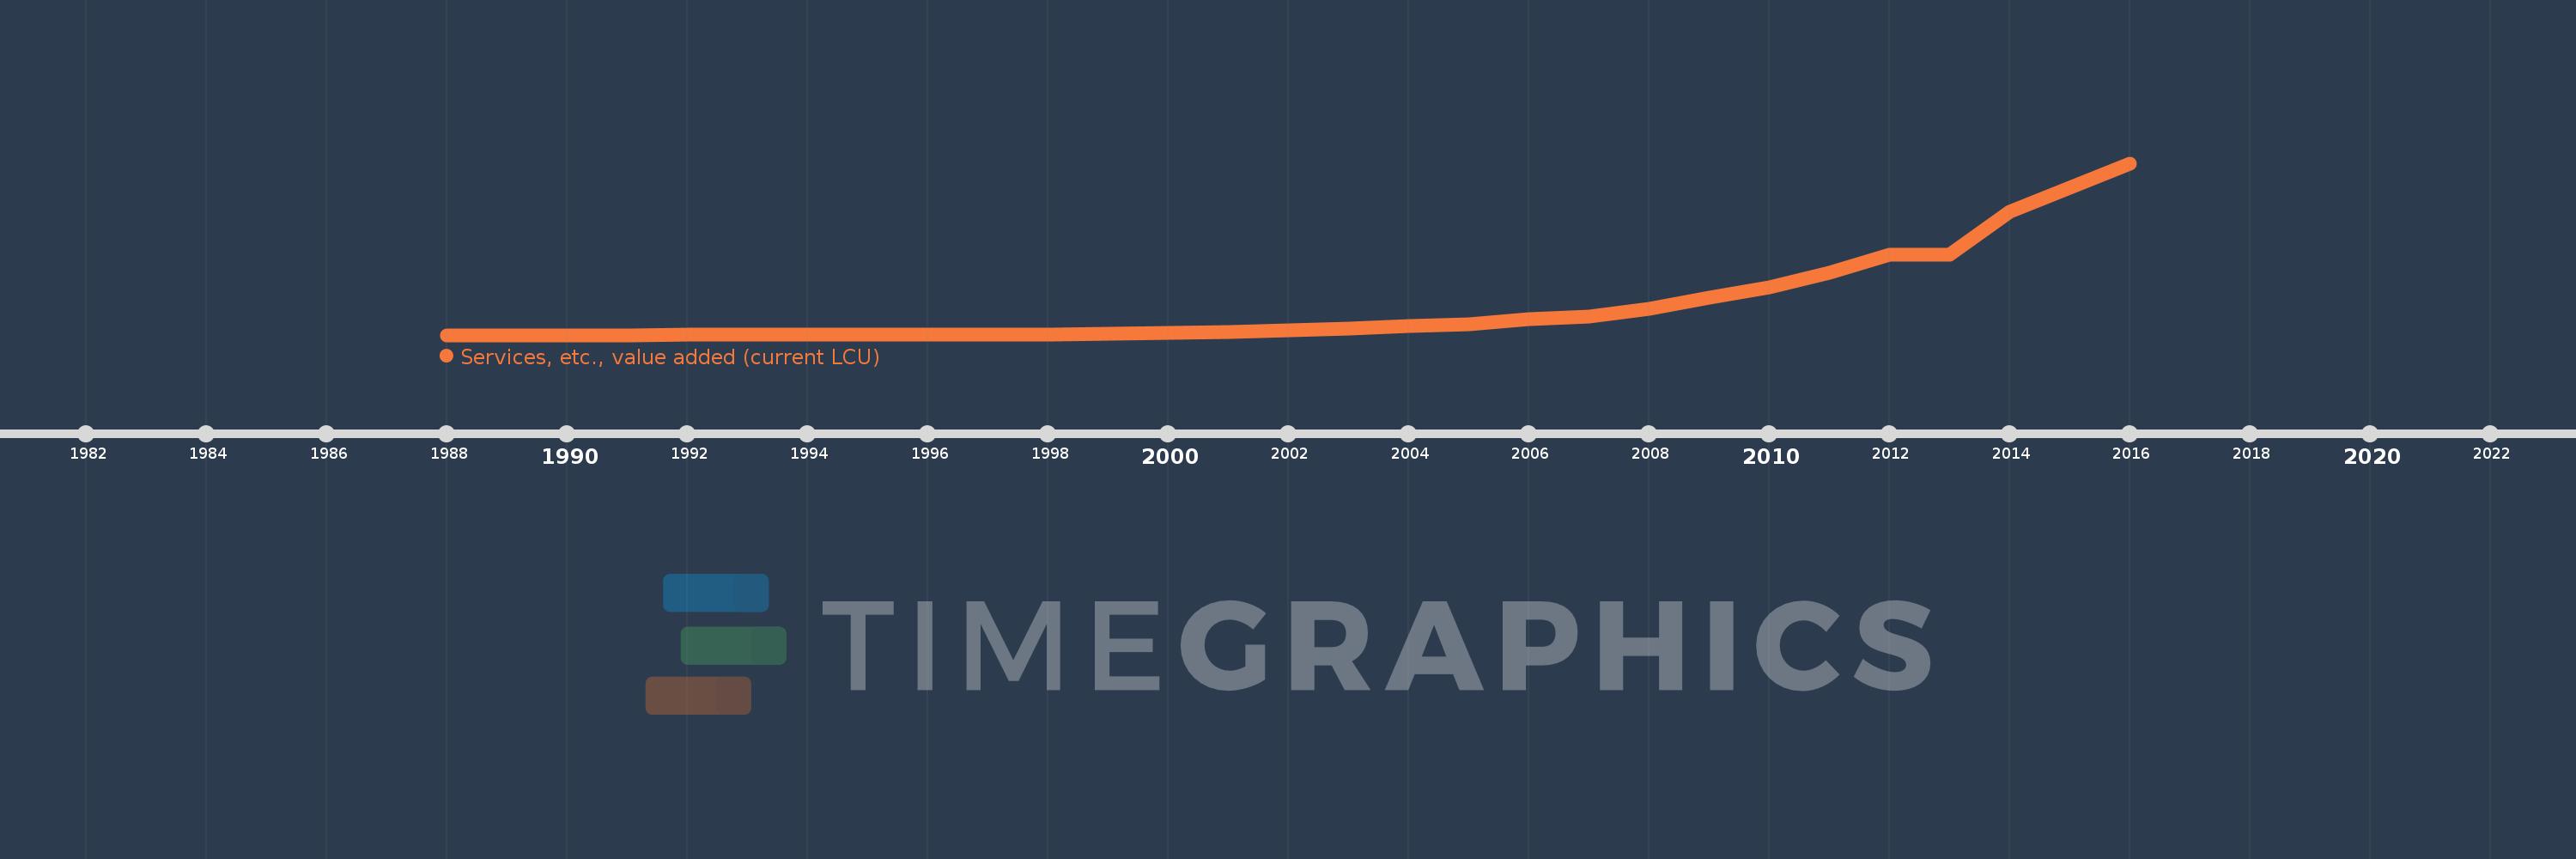
Services, etc., value added (current LCU)
2016,2015,2014,2013,2012,2011,2010,2009,2008,2007,2006,2005,2004,2003,2002,2001,2000,1999,1998,1997,1996,1995,1994,1993,1992,1991,1990,1989,1988
This statistics in other country:
AfghanistanAlbaniaAlgeriaAndorraAngolaAntigua and BarbudaArgentinaArmeniaArubaAustraliaAustriaAzerbaijanBahamas, TheBahrainBangladeshBarbadosBelarusBelgiumBelizeBeninBermudaBhutanBoliviaBosnia and HerzegovinaBotswanaBrazilBrunei DarussalamBulgariaBurkina FasoBurundiCabo VerdeCambodiaCameroonCanadaCentral African RepublicChadChileChinaColombiaComorosCongo, Dem. Rep.Congo, Rep.Costa RicaCote d'IvoireCroatiaCubaCyprusCzech RepublicDenmarkDjiboutiDominicaDominican RepublicEcuadorEgypt, Arab Rep.El SalvadorEquatorial GuineaEritreaEstoniaEthiopiaFaroe IslandsFijiFinlandFranceGabonGambia, TheGeorgiaGermanyGhanaGreeceGrenadaGuatemalaGuineaGuinea-BissauGuyanaHondurasHong Kong SAR, ChinaHungaryIcelandIndiaIndonesiaIran, Islamic Rep.IraqIrelandItalyJamaicaJapanJordanKazakhstanKenyaKiribatiKorea, Rep.KosovoKuwaitKyrgyz RepublicLao PDRLatviaLebanonLesothoLiberiaLibyaLithuaniaLuxembourgMacao SAR, ChinaMacedonia, FYRMadagascarMalawiMalaysiaMaldivesMaliMaltaMarshall IslandsMauritaniaMauritiusMexicoMicronesia, Fed. Sts.MoldovaMongoliaMontenegroMoroccoMozambiqueMyanmarNamibiaNepalNetherlandsNew CaledoniaNew ZealandNicaraguaNigerNigeriaNorwayOmanPakistanPalauPanamaPapua New GuineaParaguayPeruPhilippinesPolandPortugalPuerto RicoQatarRomaniaRussian FederationRwandaSamoaSao Tome and PrincipeSaudi ArabiaSenegalSerbiaSeychellesSierra LeoneSingaporeSlovak RepublicSloveniaSolomon IslandsSomaliaSouth AfricaSpainSri LankaSt. Kitts and NevisSt. LuciaSt. Vincent and the GrenadinesSudanSurinameSwazilandSwedenSwitzerlandSyrian Arab RepublicTajikistanTanzaniaThailandTimor-LesteTogoTongaTrinidad and TobagoTunisiaTurkeyTurkmenistanTuvaluUgandaUkraineUnited Arab EmiratesUnited KingdomUnited StatesUruguayUzbekistanVanuatuVenezuela, RBVietnamWest Bank and GazaYemen, Rep.ZambiaZimbabwe Timeline:
This timeline shows a graph from 1988 to 2016 of Uzbekistan. No data until 1987. Number of actual observations by date: 29.
Source name:
World Development Indicators
Source organization:
World Bank national accounts data, and OECD National Accounts data files.
Categories, topics:
Economy & Growth
Last updated:
apr 23, 2017
Indicators value changes by year
Minimum:
8.597 mln
jan 1, 1988
Maximum:
73.63 trl
jan 1, 2016
At the date of observation
Value
Absolute change
Change from previous value
jan 1, 1988
8.597 mln
+8.597 mln
0.0%
jan 1, 1989
9.835 mln
+1.238 mln
14.4%
jan 1, 1990
11.144 mln
+1.309 mln
13.31%
jan 1, 1991
11.233 mln
+89.2K
0.8%
jan 1, 1992
16.334 mln
+5.101 mln
45.41%
jan 1, 1993
131.52 mln
+115.186 mln
705.17%
jan 1, 1994
1.625 bln
+1.493 bln
1.14K%
jan 1, 1995
21.52 bln
+19.895 bln
1.22K%
jan 1, 1996
104.955 bln
+83.435 bln
387.71%
jan 1, 1997
207.551 bln
+102.596 bln
97.75%
jan 1, 1998
357.012 bln
+149.461 bln
72.01%
jan 1, 1999
515.482 bln
+158.47 bln
44.39%
jan 1, 2000
777.06 bln
+261.578 bln
50.74%
jan 1, 2001
1.211 trl
+433.707 bln
55.81%
jan 1, 2002
1.882 trl
+671.458 bln
55.46%
jan 1, 2003
2.864 trl
+981.296 bln
52.13%
jan 1, 2004
3.684 trl
+820.894 bln
28.67%
jan 1, 2005
4.559 trl
+874.485 bln
23.73%
jan 1, 2006
6.956 trl
+2.397 trl
52.59%
jan 1, 2007
8.019 trl
+1.062 trl
15.27%
jan 1, 2008
11.208 trl
+3.189 trl
39.77%
jan 1, 2009
16.116 trl
+4.907 trl
43.79%
jan 1, 2010
20.425 trl
+4.309 trl
26.74%
jan 1, 2011
26.529 trl
+6.105 trl
29.89%
jan 1, 2012
34.272 trl
+7.742 trl
29.18%
jan 1, 2013
34.315 trl
+42.718 bln
0.12%
jan 1, 2014
52.994 trl
+18.679 trl
54.44%
jan 1, 2015
63.08 trl
+10.086 trl
19.03%
jan 1, 2016
73.63 trl
+10.55 trl
16.72%
Ranking of countries by current statistics by years


Comments: