29
/
en
AIzaSyAYiBZKx7MnpbEhh9jyipgxe19OcubqV5w
April 1, 2024
110360
Congo, Dem. Rep.
COD
true
2
1
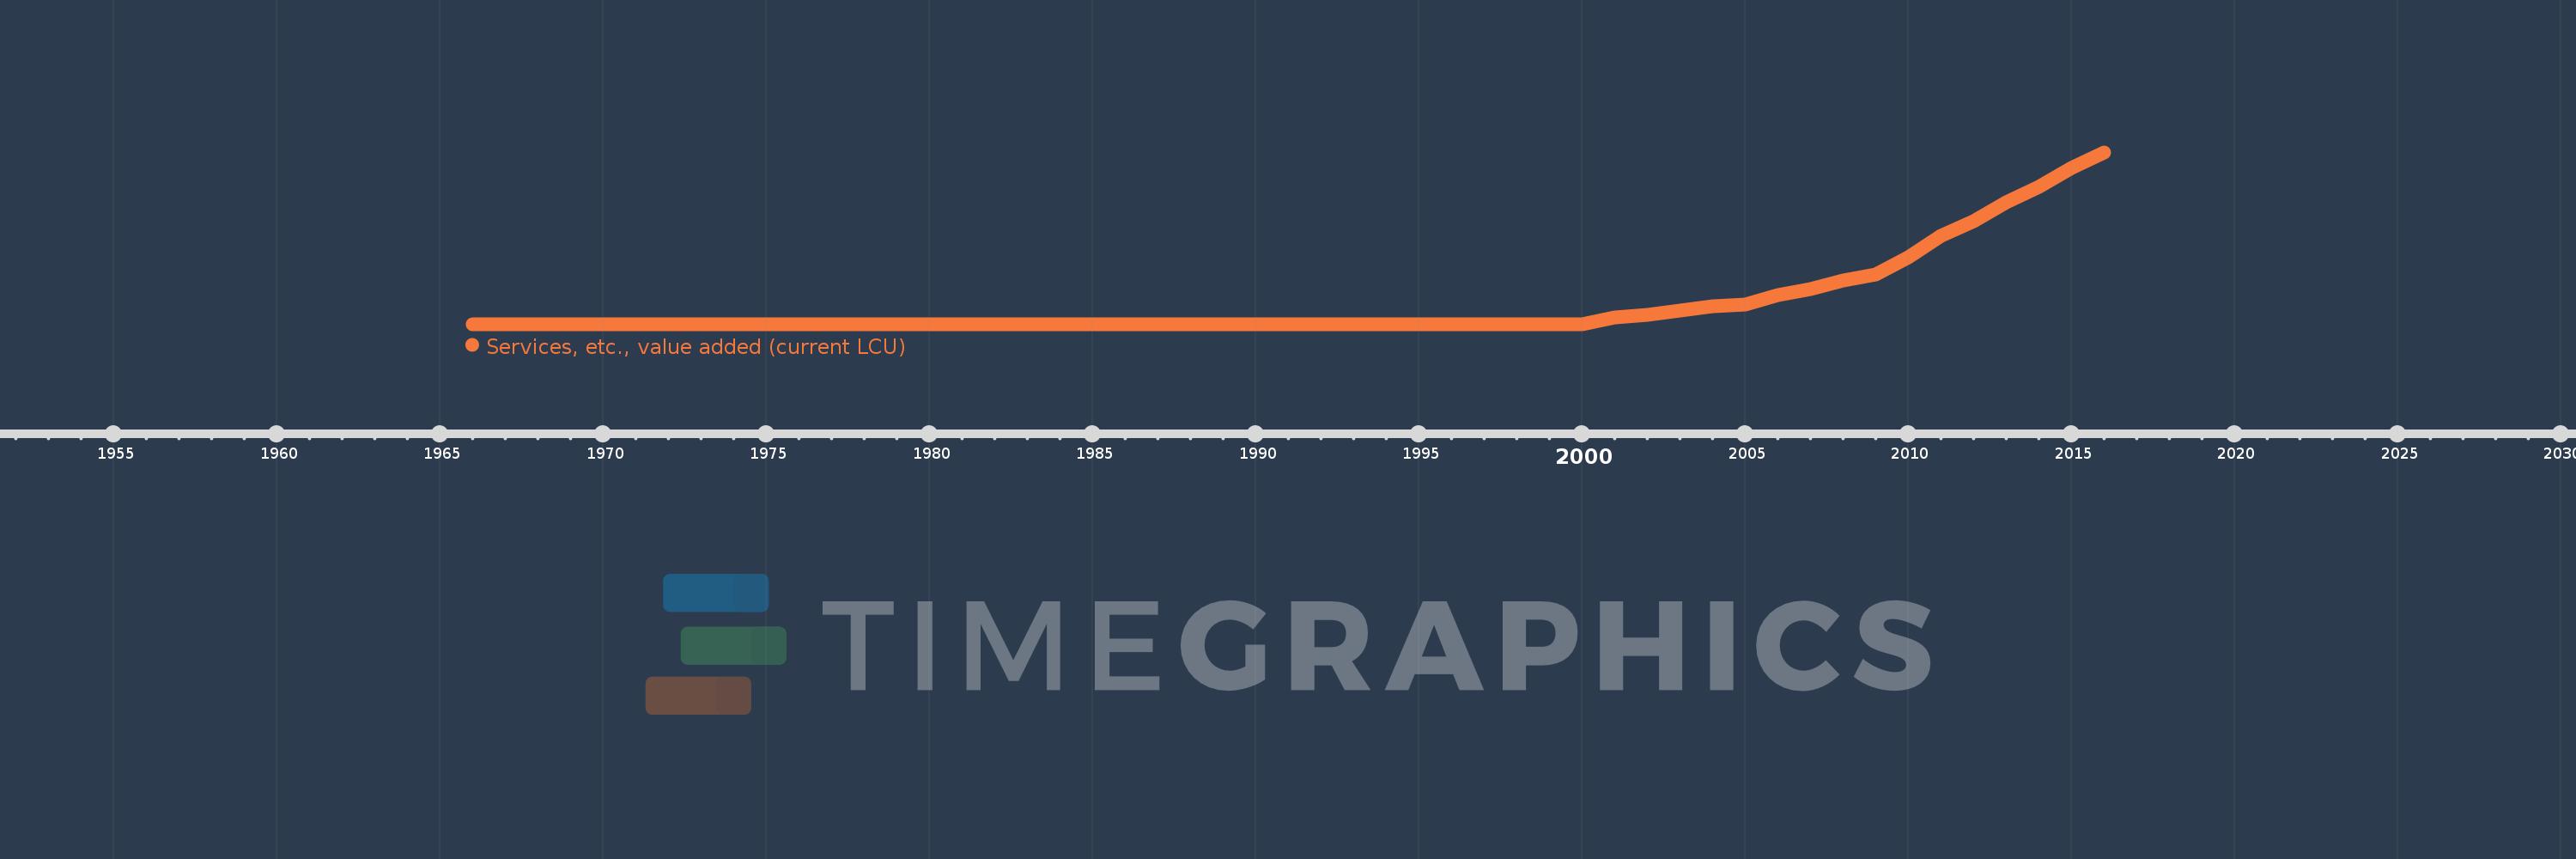
Services, etc., value added (current LCU)
2016,2015,2014,2013,2012,2011,2010,2009,2008,2007,2006,2005,2004,2003,2002,2001,2000,1999,1998,1997,1996,1995,1994,1993,1992,1991,1990,1989,1988,1987,1986,1985,1984,1983,1982,1981,1980,1979,1978,1977,1976,1975,1974,1973,1972,1971,1970,1969,1968,1967,1966
This statistics in other country:
AfghanistanAlbaniaAlgeriaAndorraAngolaAntigua and BarbudaArgentinaArmeniaArubaAustraliaAustriaAzerbaijanBahamas, TheBahrainBangladeshBarbadosBelarusBelgiumBelizeBeninBermudaBhutanBoliviaBosnia and HerzegovinaBotswanaBrazilBrunei DarussalamBulgariaBurkina FasoBurundiCabo VerdeCambodiaCameroonCanadaCentral African RepublicChadChileChinaColombiaComorosCongo, Dem. Rep.Congo, Rep.Costa RicaCote d'IvoireCroatiaCubaCyprusCzech RepublicDenmarkDjiboutiDominicaDominican RepublicEcuadorEgypt, Arab Rep.El SalvadorEquatorial GuineaEritreaEstoniaEthiopiaFaroe IslandsFijiFinlandFranceGabonGambia, TheGeorgiaGermanyGhanaGreeceGrenadaGuatemalaGuineaGuinea-BissauGuyanaHondurasHong Kong SAR, ChinaHungaryIcelandIndiaIndonesiaIran, Islamic Rep.IraqIrelandItalyJamaicaJapanJordanKazakhstanKenyaKiribatiKorea, Rep.KosovoKuwaitKyrgyz RepublicLao PDRLatviaLebanonLesothoLiberiaLibyaLithuaniaLuxembourgMacao SAR, ChinaMacedonia, FYRMadagascarMalawiMalaysiaMaldivesMaliMaltaMarshall IslandsMauritaniaMauritiusMexicoMicronesia, Fed. Sts.MoldovaMongoliaMontenegroMoroccoMozambiqueMyanmarNamibiaNepalNetherlandsNew CaledoniaNew ZealandNicaraguaNigerNigeriaNorwayOmanPakistanPalauPanamaPapua New GuineaParaguayPeruPhilippinesPolandPortugalPuerto RicoQatarRomaniaRussian FederationRwandaSamoaSao Tome and PrincipeSaudi ArabiaSenegalSerbiaSeychellesSierra LeoneSingaporeSlovak RepublicSloveniaSolomon IslandsSomaliaSouth AfricaSpainSri LankaSt. Kitts and NevisSt. LuciaSt. Vincent and the GrenadinesSudanSurinameSwazilandSwedenSwitzerlandSyrian Arab RepublicTajikistanTanzaniaThailandTimor-LesteTogoTongaTrinidad and TobagoTunisiaTurkeyTurkmenistanTuvaluUgandaUkraineUnited Arab EmiratesUnited KingdomUnited StatesUruguayUzbekistanVanuatuVenezuela, RBVietnamWest Bank and GazaYemen, Rep.ZambiaZimbabwe Timeline:
This timeline shows a graph from 1966 to 2016 of Congo, Dem. Rep.. No data until 1965. Number of actual observations by date: 51.
Source name:
World Development Indicators
Source organization:
World Bank national accounts data, and OECD National Accounts data files.
Categories, topics:
Economy & Growth
Last updated:
apr 23, 2017
Indicators value changes by year
Maximum:
14.551 trl
jan 1, 2016
At the date of observation
Value
Absolute change
Change from previous value
jan 1, 1966
0.001
+0.001
0.0%
jan 1, 1967
0.001
+0.0
12.82%
jan 1, 1968
0.002
+0.001
57.16%
jan 1, 1969
0.003
+0.001
53.5%
jan 1, 1970
0.004
+0.001
26.06%
jan 1, 1971
0.003
-0.001
-21.05%
jan 1, 1972
0.004
+0.001
29.12%
jan 1, 1973
0.004
+0.001
18.52%
jan 1, 1974
0.005
+0.001
15.26%
jan 1, 1975
0.006
+0.001
20.17%
jan 1, 1976
0.007
+0.001
17.94%
jan 1, 1977
0.011
+0.004
57.31%
jan 1, 1978
0.017
+0.006
51.09%
jan 1, 1979
0.02
+0.003
15.23%
jan 1, 1980
0.037
+0.018
89.49%
jan 1, 1981
0.048
+0.011
30.05%
jan 1, 1982
0.07
+0.022
45.3%
jan 1, 1983
0.102
+0.032
44.78%
jan 1, 1984
0.174
+0.072
70.88%
jan 1, 1985
0.351
+0.177
101.82%
jan 1, 1986
0.418
+0.066
18.83%
jan 1, 1987
0.605
+0.187
44.77%
jan 1, 1988
1.176
+0.571
94.53%
jan 1, 1989
2.145
+0.969
82.4%
jan 1, 1990
4.448
+2.303
107.37%
jan 1, 1991
8.73
+4.282
96.28%
jan 1, 1992
190.881
+182.15
2.09K%
jan 1, 1993
5.972K
+5.781K
3.03K%
jan 1, 1994
84.851K
+78.879K
1.32K%
jan 1, 1995
18.615 mln
+18.531 mln
21.84K%
jan 1, 1996
102.245 mln
+83.63 mln
449.25%
jan 1, 1997
970.9 mln
+868.655 mln
849.58%
jan 1, 1998
2.394 bln
+1.423 bln
146.59%
jan 1, 1999
3.095 bln
+701.4 mln
29.3%
jan 1, 2000
14.663 bln
+11.568 bln
373.7%
jan 1, 2001
586.275 bln
+571.612 bln
3.9K%
jan 1, 2002
770.857 bln
+184.582 bln
31.48%
jan 1, 2003
1.151 trl
+380.549 bln
49.37%
jan 1, 2004
1.521 trl
+369.961 bln
32.13%
jan 1, 2005
1.653 trl
+131.228 bln
8.63%
jan 1, 2006
2.441 trl
+788.071 bln
47.69%
jan 1, 2007
2.978 trl
+537.386 bln
22.02%
jan 1, 2008
3.697 trl
+719.259 bln
24.15%
jan 1, 2009
4.177 trl
+479.996 bln
12.98%
jan 1, 2010
5.646 trl
+1.469 trl
35.16%
jan 1, 2011
7.506 trl
+1.86 trl
32.94%
jan 1, 2012
8.759 trl
+1.253 trl
16.69%
jan 1, 2013
10.315 trl
+1.556 trl
17.76%
jan 1, 2014
11.6 trl
+1.286 trl
12.46%
jan 1, 2015
13.243 trl
+1.643 trl
14.16%
jan 1, 2016
14.551 trl
+1.308 trl
9.88%
Ranking of countries by current statistics by years


Comments: