29
/
en
AIzaSyAYiBZKx7MnpbEhh9jyipgxe19OcubqV5w
April 1, 2024
221533
Paraguay
PRY
true
2
1
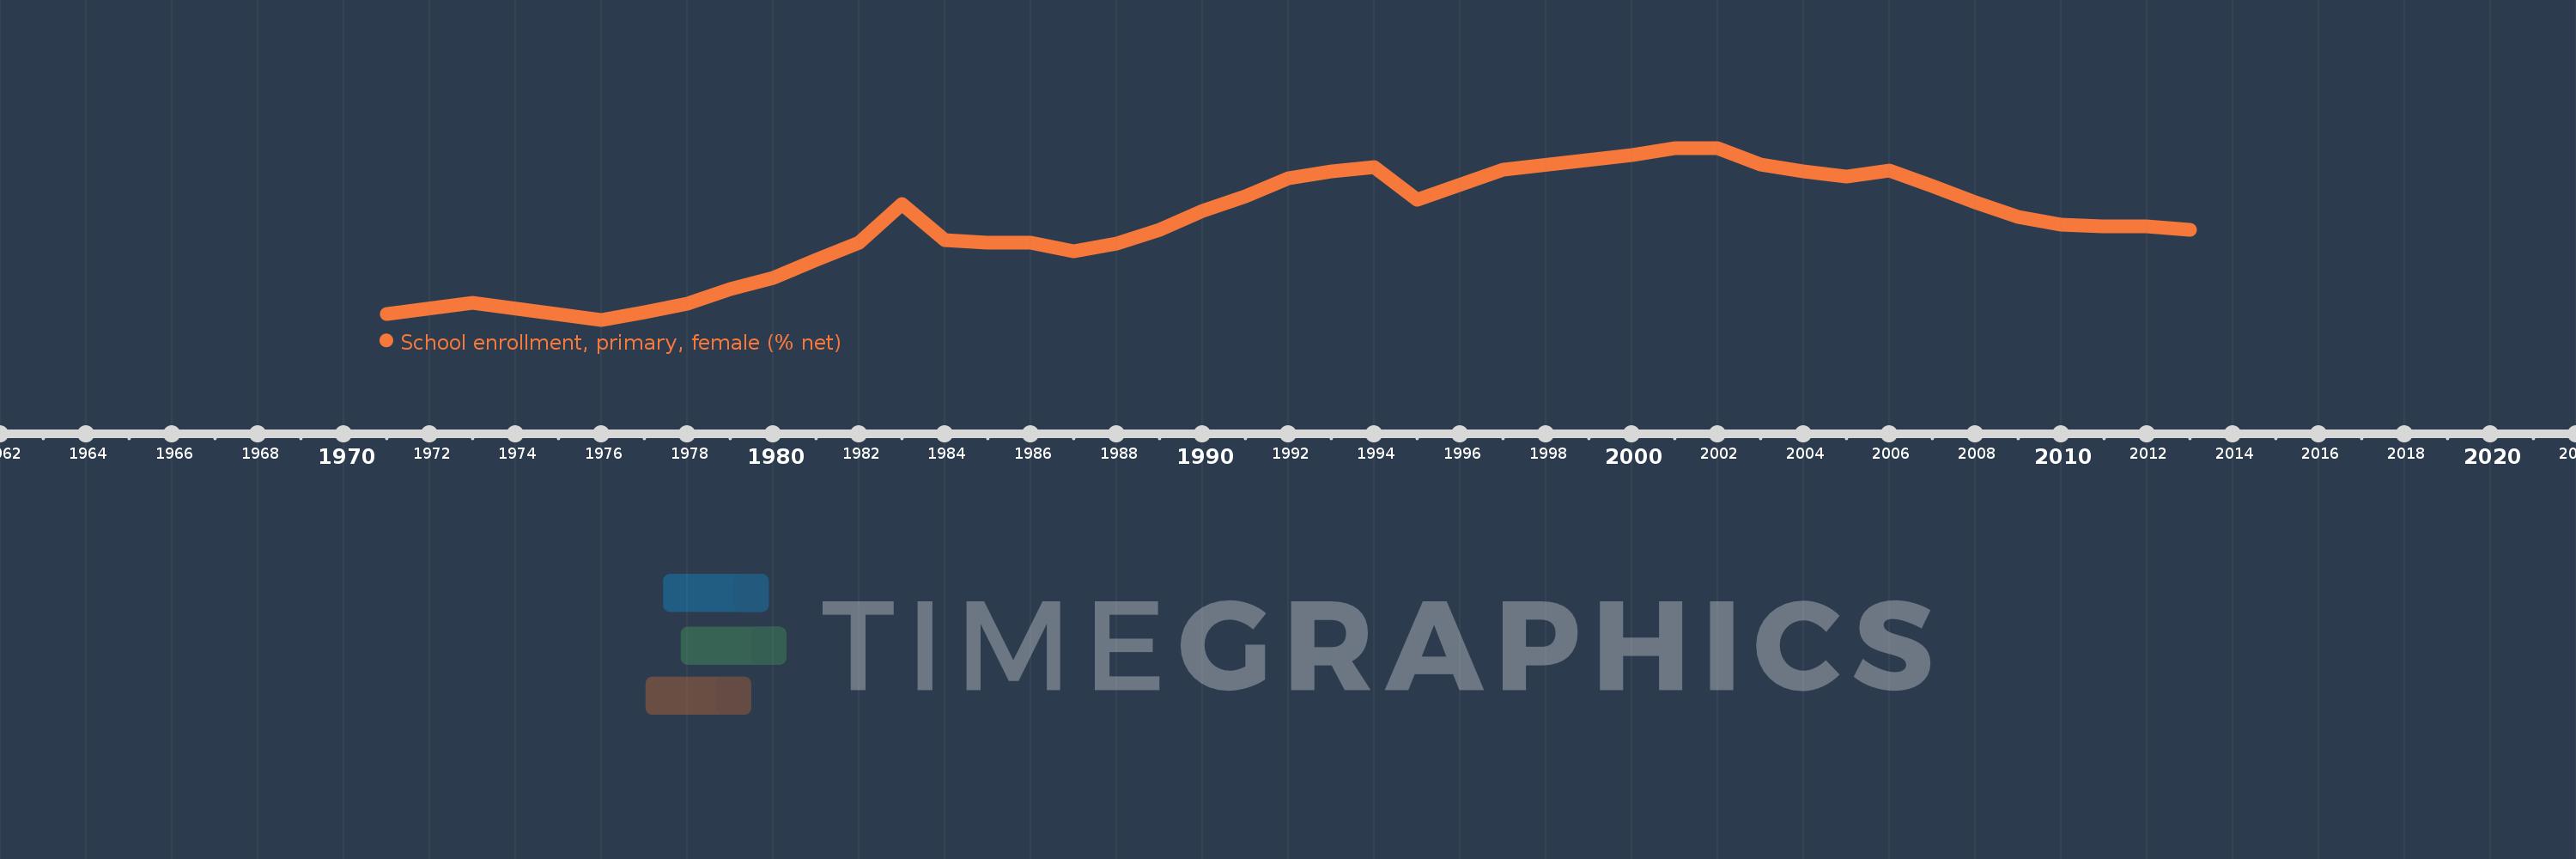
School enrollment, primary, female (% net)
2013,2012,2011,2010,2009,2008,2007,2006,2005,2004,2003,2002,2001,2000,1997,1995,1994,1993,1992,1991,1990,1989,1988,1987,1986,1985,1984,1983,1982,1981,1980,1979,1978,1977,1976,1973,1971
This statistics in other country:
AfghanistanAlbaniaAlgeriaAngolaAntigua and BarbudaArab WorldArgentinaArmeniaArubaAustraliaAustriaAzerbaijanBahamas, TheBahrainBangladeshBarbadosBelarusBelgiumBelizeBeninBermudaBhutanBoliviaBosnia and HerzegovinaBotswanaBrazilBrunei DarussalamBulgariaBurkina FasoBurundiCabo VerdeCambodiaCameroonCanadaCaribbean small statesCentral African RepublicCentral Europe and the BalticsChadChileChinaColombiaComorosCongo, Dem. Rep.Congo, Rep.Costa RicaCote d'IvoireCroatiaCubaCyprusDenmarkDjiboutiDominicaDominican RepublicEarly-demographic dividendEast Asia & PacificEast Asia & Pacific (excluding high income)East Asia & Pacific (IDA & IBRD countries)EcuadorEgypt, Arab Rep.El SalvadorEquatorial GuineaEritreaEstoniaEthiopiaEuro areaEurope & Central AsiaEurope & Central Asia (excluding high income)Europe & Central Asia (IDA & IBRD countries)European UnionFijiFinlandFragile and conflict affected situationsFranceGabonGambia, TheGeorgiaGhanaGreeceGrenadaGuatemalaGuineaGuinea-BissauGuyanaHaitiHeavily indebted poor countries (HIPC)High incomeHondurasHong Kong SAR, ChinaHungaryIBRD onlyIcelandIDA & IBRD totalIDA blendIDA onlyIDA totalIndiaIndonesiaIran, Islamic Rep.IraqIrelandIsraelItalyJamaicaJapanJordanKazakhstanKenyaKiribatiKorea, Dem. People’s Rep.Korea, Rep.KuwaitKyrgyz RepublicLao PDRLate-demographic dividendLatin America & Caribbean Latin America & Caribbean (excluding high income)Latin America & the Caribbean (IDA & IBRD countries)LatviaLeast developed countries: UN classificationLebanonLesothoLiberiaLibyaLiechtensteinLithuaniaLow & middle incomeLow incomeLower middle incomeLuxembourgMacao SAR, ChinaMacedonia, FYRMadagascarMalawiMaldivesMaliMaltaMarshall IslandsMauritaniaMauritiusMexicoMicronesia, Fed. Sts.Middle East & North AfricaMiddle East & North Africa (excluding high income)Middle East & North Africa (IDA & IBRD countries)Middle incomeMoldovaMongoliaMontenegroMoroccoMozambiqueMyanmarNamibiaNauruNepalNetherlandsNew ZealandNicaraguaNigerNigeriaNorth AmericaNorwayOECD membersOmanOther small statesPacific island small statesPakistanPanamaPapua New GuineaParaguayPeruPhilippinesPolandPortugalPost-demographic dividendPre-demographic dividendPuerto RicoQatarRomaniaRussian FederationRwandaSamoaSan MarinoSao Tome and PrincipeSaudi ArabiaSenegalSerbiaSeychellesSierra LeoneSloveniaSmall statesSolomon IslandsSomaliaSouth AfricaSouth AsiaSouth Asia (IDA & IBRD)South SudanSpainSri LankaSt. Kitts and NevisSt. LuciaSt. Vincent and the GrenadinesSub-Saharan Africa Sub-Saharan Africa (excluding high income)Sub-Saharan Africa (IDA & IBRD countries)SudanSurinameSwazilandSwedenSwitzerlandSyrian Arab RepublicTajikistanTanzaniaThailandTimor-LesteTogoTongaTrinidad and TobagoTunisiaTurkeyTuvaluUgandaUkraineUnited Arab EmiratesUnited KingdomUnited StatesUpper middle incomeUruguayUzbekistanVanuatuVenezuela, RBWest Bank and GazaWorldYemen, Rep.ZambiaZimbabwe Timeline:
This timeline shows a graph from 1971 to 2013 of Paraguay. No data until 1970. Number of actual observations by date: 37.
Source name:
World Development Indicators
Source organization:
United Nations Educational, Scientific, and Cultural Organization (UNESCO) Institute for Statistics.
Categories, topics:
Education, Gender
Last updated:
apr 23, 2017
Indicators value changes by year
Minimum:
78.177
jan 1, 1976
Maximum:
97.652
jan 1, 2001
At the date of observation
Value
Absolute change
Change from previous value
jan 1, 1971
78.811
+78.811
0.0%
jan 1, 1973
80.076
+1.264
1.6%
jan 1, 1976
78.177
-1.899
-2.37%
jan 1, 1977
79.015
+0.838
1.07%
jan 1, 1978
79.987
+0.972
1.23%
jan 1, 1979
81.647
+1.66
2.08%
jan 1, 1980
82.901
+1.254
1.54%
jan 1, 1981
84.992
+2.091
2.52%
jan 1, 1982
86.933
+1.941
2.28%
jan 1, 1983
91.297
+4.364
5.02%
jan 1, 1984
87.155
-4.142
-4.54%
jan 1, 1985
86.89
-0.265
-0.3%
jan 1, 1986
86.932
+0.042
0.05%
jan 1, 1987
85.903
-1.029
-1.18%
jan 1, 1988
86.803
+0.9
1.05%
jan 1, 1989
88.404
+1.601
1.84%
jan 1, 1990
90.534
+2.13
2.41%
jan 1, 1991
92.135
+1.602
1.77%
jan 1, 1992
94.235
+2.099
2.28%
jan 1, 1993
95.011
+0.776
0.82%
jan 1, 1994
95.47
+0.459
0.48%
jan 1, 1995
91.807
-3.663
-3.84%
jan 1, 1997
95.222
+3.415
3.72%
jan 1, 2000
96.87
+1.647
1.73%
jan 1, 2001
97.652
+0.783
0.81%
jan 1, 2002
97.624
-0.028
-0.03%
jan 1, 2003
95.791
-1.833
-1.88%
jan 1, 2004
94.951
-0.84
-0.88%
jan 1, 2005
94.411
-0.54
-0.57%
jan 1, 2006
95.074
+0.663
0.7%
jan 1, 2007
93.309
-1.765
-1.86%
jan 1, 2008
91.449
-1.859
-1.99%
jan 1, 2009
89.827
-1.622
-1.77%
jan 1, 2010
88.947
-0.88
-0.98%
jan 1, 2011
88.786
-0.161
-0.18%
jan 1, 2012
88.771
-0.015
-0.02%
jan 1, 2013
88.326
-0.445
-0.5%
Ranking of countries by current statistics by years


Comments: