30
/
AIzaSyAYiBZKx7MnpbEhh9jyipgxe19OcubqV5w
April 1, 2024
170468
Korea, Rep.
KOR
true
2
1
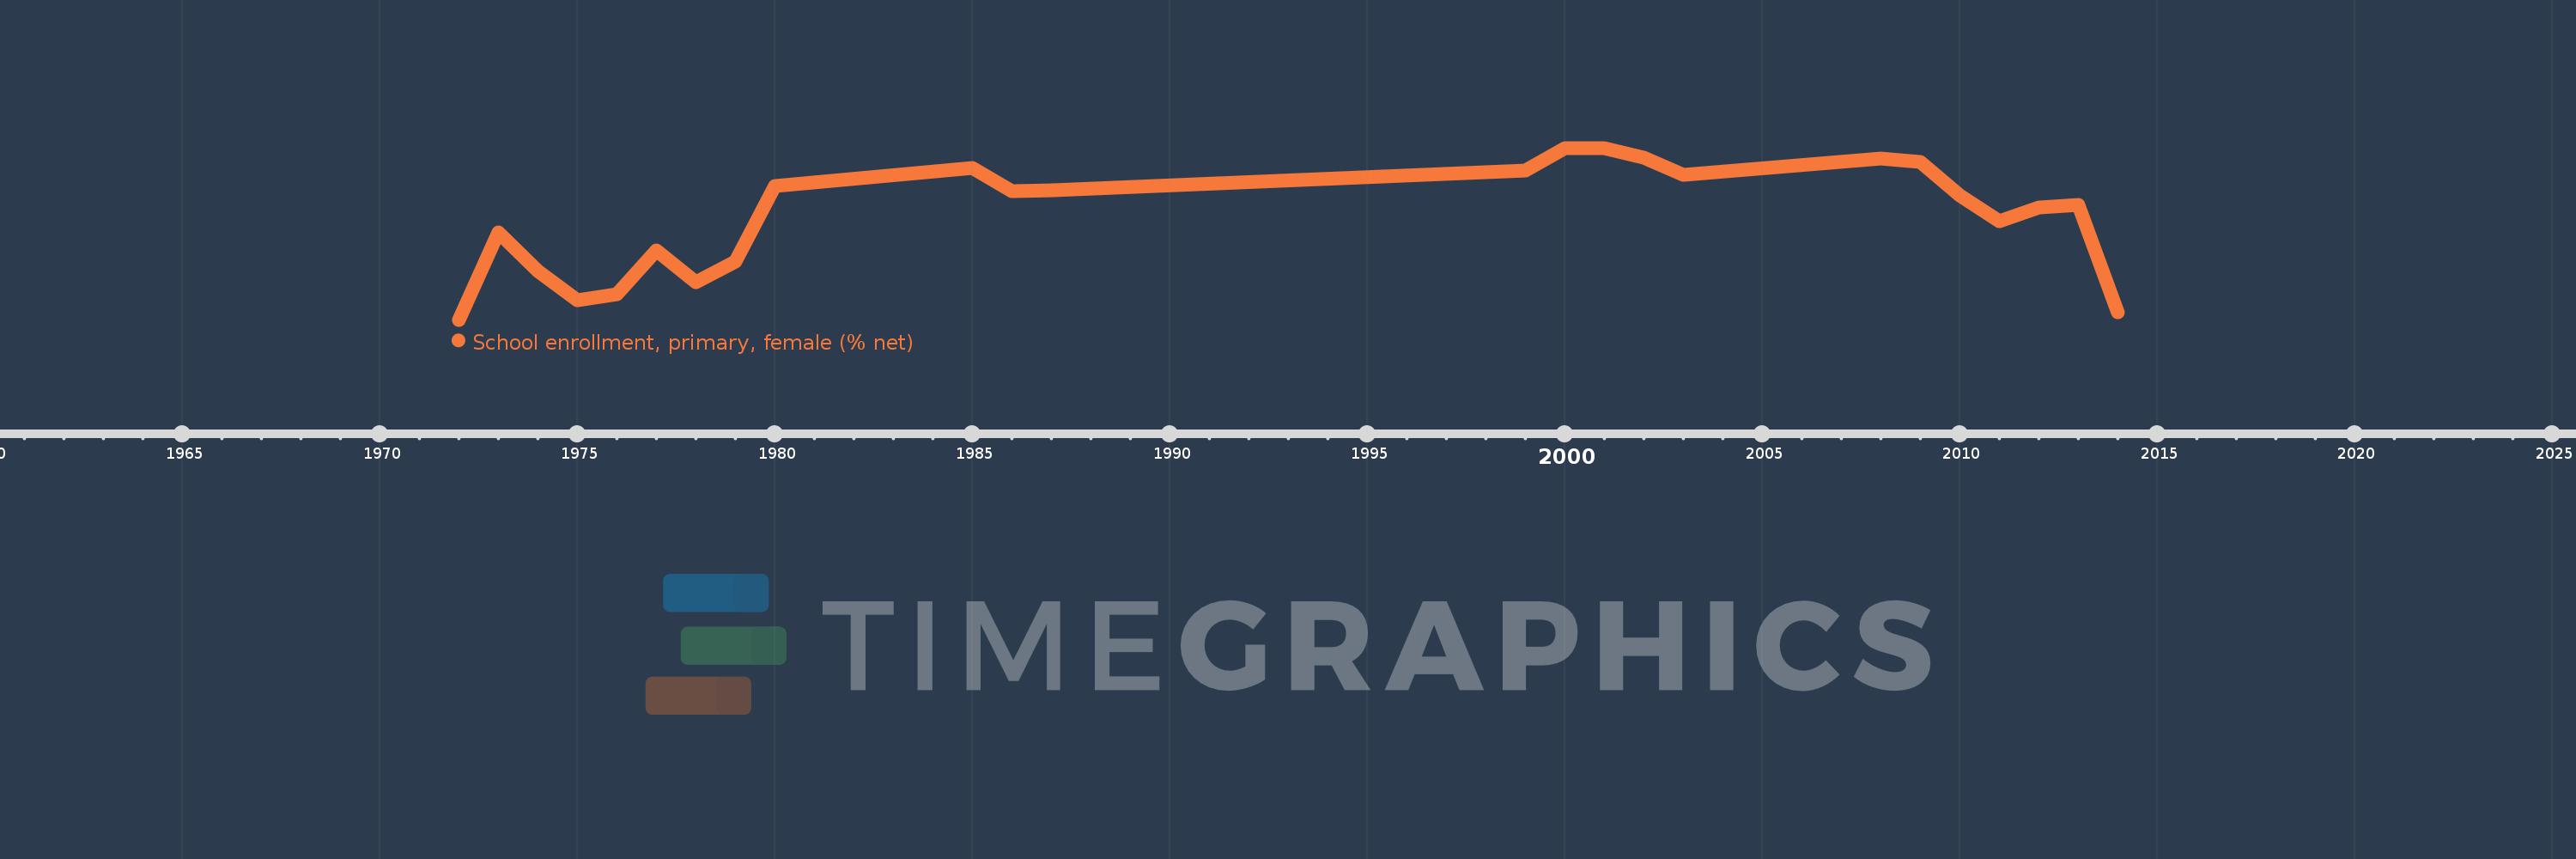
School enrollment, primary, female (% net)
2014,2013,2012,2011,2010,2009,2008,2003,2002,2001,2000,1999,1987,1986,1985,1980,1979,1978,1977,1976,1975,1974,1973,1972
