29
/
en
AIzaSyAYiBZKx7MnpbEhh9jyipgxe19OcubqV5w
April 1, 2024
42976
Latin America & Caribbean (excluding high income)
LAC
false
2
1
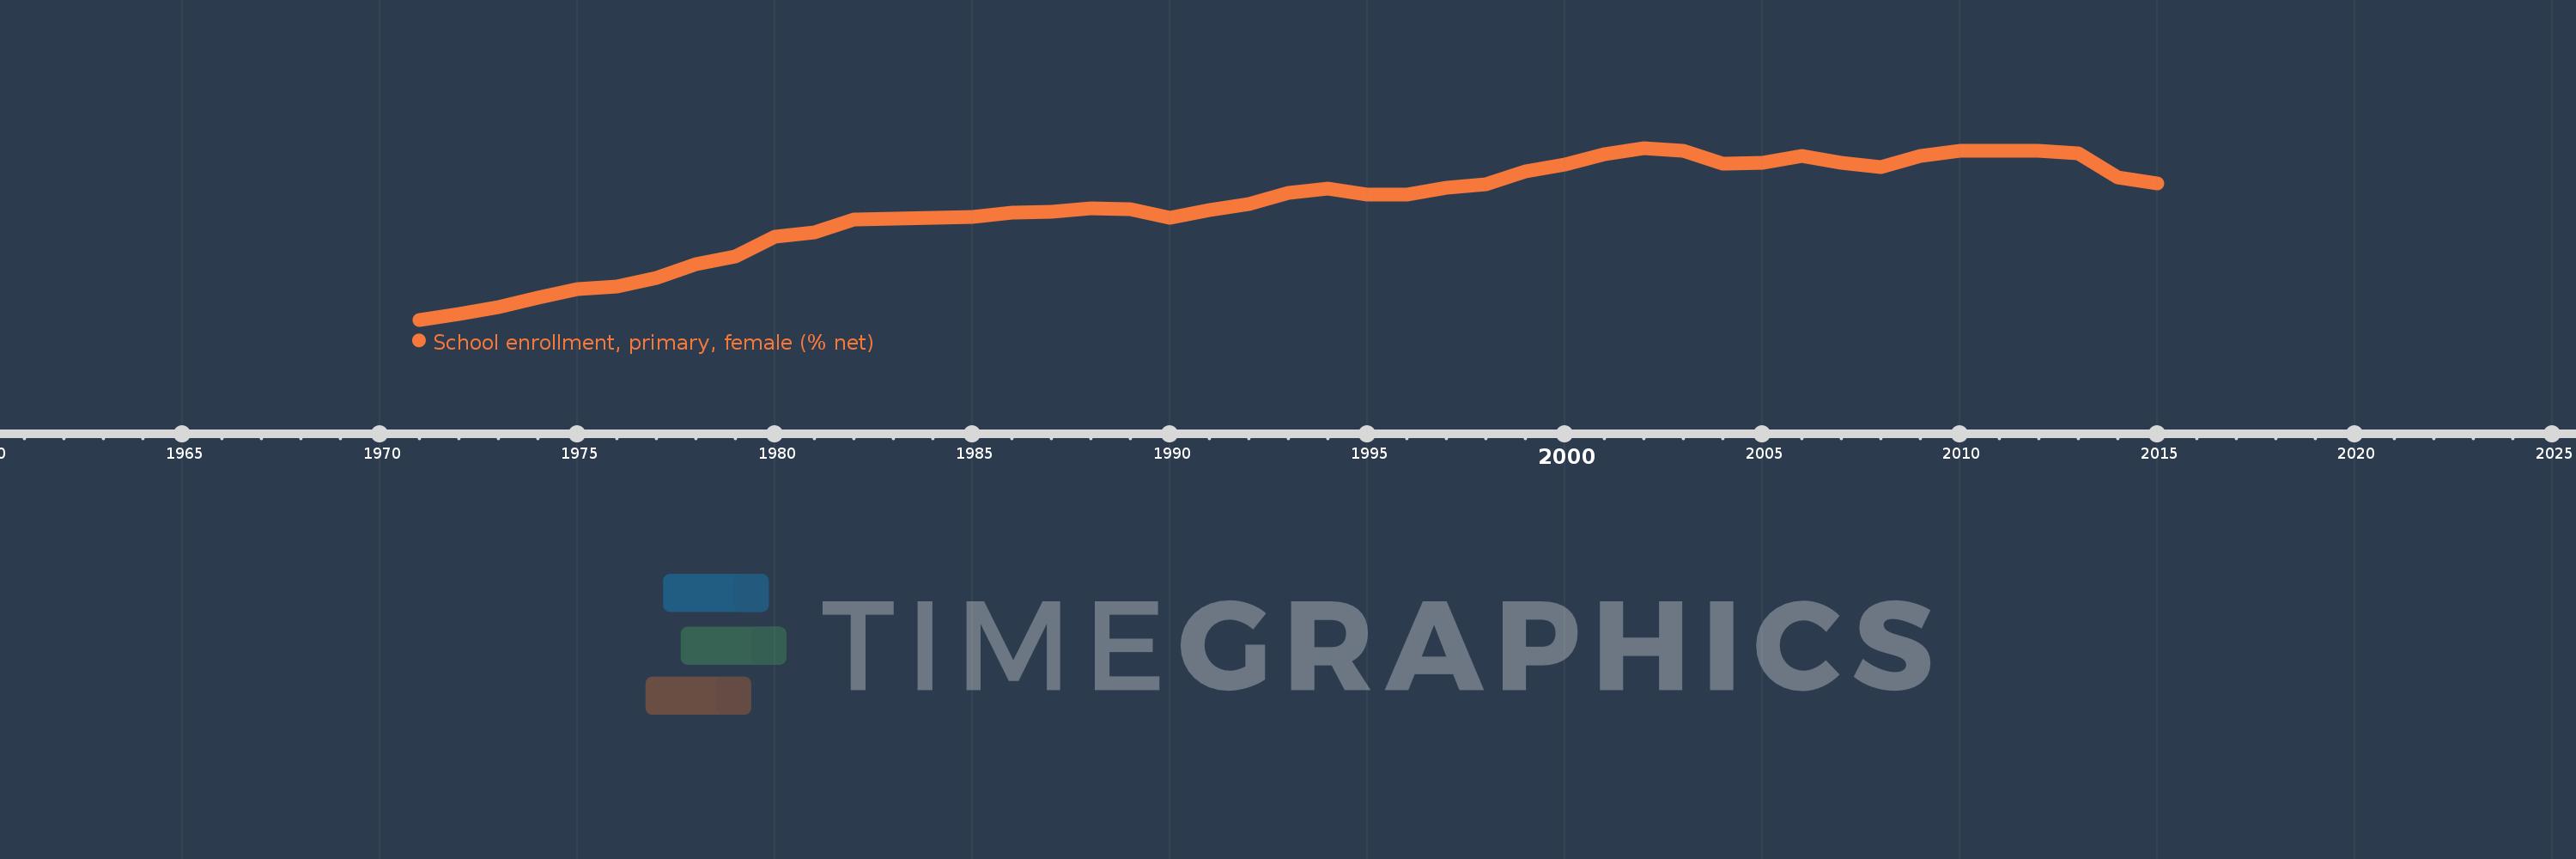
School enrollment, primary, female (% net)
2015,2014,2013,2012,2011,2010,2009,2008,2007,2006,2005,2004,2003,2002,2001,2000,1999,1998,1997,1996,1995,1994,1993,1992,1991,1990,1989,1988,1987,1986,1985,1984,1983,1982,1981,1980,1979,1978,1977,1976,1975,1974,1973,1972,1971
This statistics in other country:
AfghanistanAlbaniaAlgeriaAngolaAntigua and BarbudaArab WorldArgentinaArmeniaArubaAustraliaAustriaAzerbaijanBahamas, TheBahrainBangladeshBarbadosBelarusBelgiumBelizeBeninBermudaBhutanBoliviaBosnia and HerzegovinaBotswanaBrazilBrunei DarussalamBulgariaBurkina FasoBurundiCabo VerdeCambodiaCameroonCanadaCaribbean small statesCentral African RepublicCentral Europe and the BalticsChadChileChinaColombiaComorosCongo, Dem. Rep.Congo, Rep.Costa RicaCote d'IvoireCroatiaCubaCyprusDenmarkDjiboutiDominicaDominican RepublicEarly-demographic dividendEast Asia & PacificEast Asia & Pacific (excluding high income)East Asia & Pacific (IDA & IBRD countries)EcuadorEgypt, Arab Rep.El SalvadorEquatorial GuineaEritreaEstoniaEthiopiaEuro areaEurope & Central AsiaEurope & Central Asia (excluding high income)Europe & Central Asia (IDA & IBRD countries)European UnionFijiFinlandFragile and conflict affected situationsFranceGabonGambia, TheGeorgiaGhanaGreeceGrenadaGuatemalaGuineaGuinea-BissauGuyanaHaitiHeavily indebted poor countries (HIPC)High incomeHondurasHong Kong SAR, ChinaHungaryIBRD onlyIcelandIDA & IBRD totalIDA blendIDA onlyIDA totalIndiaIndonesiaIran, Islamic Rep.IraqIrelandIsraelItalyJamaicaJapanJordanKazakhstanKenyaKiribatiKorea, Dem. People’s Rep.Korea, Rep.KuwaitKyrgyz RepublicLao PDRLate-demographic dividendLatin America & Caribbean Latin America & Caribbean (excluding high income)Latin America & the Caribbean (IDA & IBRD countries)LatviaLeast developed countries: UN classificationLebanonLesothoLiberiaLibyaLiechtensteinLithuaniaLow & middle incomeLow incomeLower middle incomeLuxembourgMacao SAR, ChinaMacedonia, FYRMadagascarMalawiMaldivesMaliMaltaMarshall IslandsMauritaniaMauritiusMexicoMicronesia, Fed. Sts.Middle East & North AfricaMiddle East & North Africa (excluding high income)Middle East & North Africa (IDA & IBRD countries)Middle incomeMoldovaMongoliaMontenegroMoroccoMozambiqueMyanmarNamibiaNauruNepalNetherlandsNew ZealandNicaraguaNigerNigeriaNorth AmericaNorwayOECD membersOmanOther small statesPacific island small statesPakistanPanamaPapua New GuineaParaguayPeruPhilippinesPolandPortugalPost-demographic dividendPre-demographic dividendPuerto RicoQatarRomaniaRussian FederationRwandaSamoaSan MarinoSao Tome and PrincipeSaudi ArabiaSenegalSerbiaSeychellesSierra LeoneSloveniaSmall statesSolomon IslandsSomaliaSouth AfricaSouth AsiaSouth Asia (IDA & IBRD)South SudanSpainSri LankaSt. Kitts and NevisSt. LuciaSt. Vincent and the GrenadinesSub-Saharan Africa Sub-Saharan Africa (excluding high income)Sub-Saharan Africa (IDA & IBRD countries)SudanSurinameSwazilandSwedenSwitzerlandSyrian Arab RepublicTajikistanTanzaniaThailandTimor-LesteTogoTongaTrinidad and TobagoTunisiaTurkeyTuvaluUgandaUkraineUnited Arab EmiratesUnited KingdomUnited StatesUpper middle incomeUruguayUzbekistanVanuatuVenezuela, RBWest Bank and GazaWorldYemen, Rep.ZambiaZimbabwe Timeline:
This timeline shows a graph from 1971 to 2015 of Latin America & Caribbean (excluding high income). No data until 1970. Number of actual observations by date: 45.
Source name:
World Development Indicators
Source organization:
United Nations Educational, Scientific, and Cultural Organization (UNESCO) Institute for Statistics.
Categories, topics:
Education, Gender
Last updated:
apr 23, 2017
Indicators value changes by year
Minimum:
81.399
jan 1, 1971
Maximum:
94.387
jan 1, 2002
At the date of observation
Value
Absolute change
Change from previous value
jan 1, 1971
81.399
+81.399
0.0%
jan 1, 1972
81.806
+0.407
0.5%
jan 1, 1973
82.346
+0.54
0.66%
jan 1, 1974
83.071
+0.725
0.88%
jan 1, 1975
83.731
+0.66
0.79%
jan 1, 1976
83.899
+0.168
0.2%
jan 1, 1977
84.571
+0.672
0.8%
jan 1, 1978
85.58
+1.009
1.19%
jan 1, 1979
86.154
+0.574
0.67%
jan 1, 1980
87.707
+1.553
1.8%
jan 1, 1981
88.001
+0.294
0.34%
jan 1, 1982
88.955
+0.953
1.08%
jan 1, 1983
89.03
+0.075
0.08%
jan 1, 1984
89.121
+0.091
0.1%
jan 1, 1985
89.155
+0.034
0.04%
jan 1, 1986
89.518
+0.363
0.41%
jan 1, 1987
89.563
+0.046
0.05%
jan 1, 1988
89.854
+0.291
0.33%
jan 1, 1989
89.742
-0.112
-0.12%
jan 1, 1990
89.113
-0.63
-0.7%
jan 1, 1991
89.708
+0.595
0.67%
jan 1, 1992
90.119
+0.411
0.46%
jan 1, 1993
91.016
+0.898
1.0%
jan 1, 1994
91.301
+0.285
0.31%
jan 1, 1995
90.881
-0.42
-0.46%
jan 1, 1996
90.876
-0.005
-0.01%
jan 1, 1997
91.357
+0.481
0.53%
jan 1, 1998
91.609
+0.252
0.28%
jan 1, 1999
92.621
+1.011
1.1%
jan 1, 2000
93.121
+0.5
0.54%
jan 1, 2001
93.908
+0.787
0.85%
jan 1, 2002
94.387
+0.479
0.51%
jan 1, 2003
94.151
-0.236
-0.25%
jan 1, 2004
93.201
-0.95
-1.01%
jan 1, 2005
93.25
+0.049
0.05%
jan 1, 2006
93.809
+0.559
0.6%
jan 1, 2007
93.256
-0.553
-0.59%
jan 1, 2008
92.908
-0.348
-0.37%
jan 1, 2009
93.797
+0.889
0.96%
jan 1, 2010
94.144
+0.347
0.37%
jan 1, 2011
94.183
+0.038
0.04%
jan 1, 2012
94.147
-0.035
-0.04%
jan 1, 2013
93.972
-0.176
-0.19%
jan 1, 2014
92.142
-1.829
-1.95%
jan 1, 2015
91.726
-0.416
-0.45%
Ranking of countries by current statistics by years


Comments: