29
/
en
AIzaSyAYiBZKx7MnpbEhh9jyipgxe19OcubqV5w
April 1, 2024
73421
Australia
AUS
true
2
1
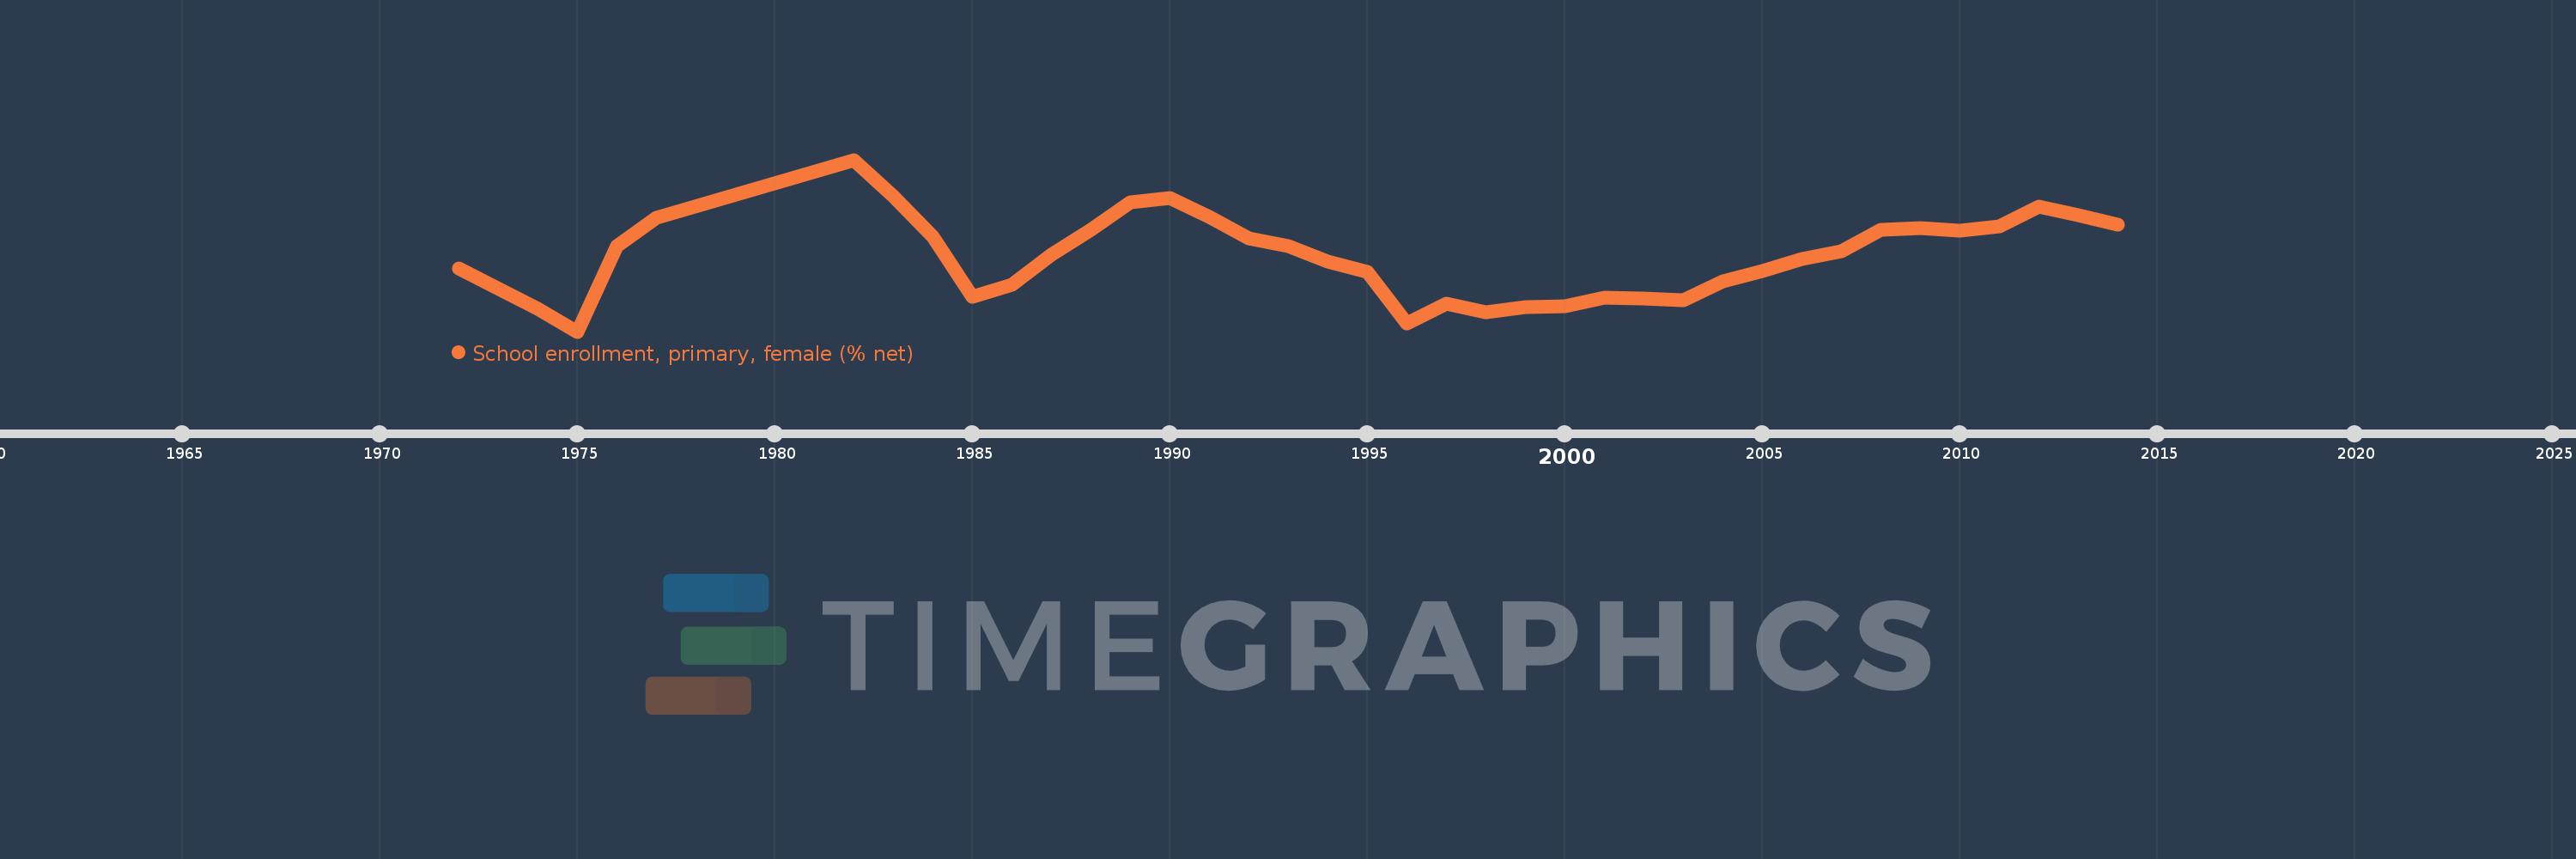
School enrollment, primary, female (% net)
2014,2013,2012,2011,2010,2009,2008,2007,2006,2005,2004,2003,2002,2001,2000,1999,1998,1997,1996,1995,1994,1993,1992,1991,1990,1989,1988,1987,1986,1985,1984,1983,1982,1977,1976,1975,1974,1972
This statistics in other country:
AfghanistanAlbaniaAlgeriaAngolaAntigua and BarbudaArab WorldArgentinaArmeniaArubaAustraliaAustriaAzerbaijanBahamas, TheBahrainBangladeshBarbadosBelarusBelgiumBelizeBeninBermudaBhutanBoliviaBosnia and HerzegovinaBotswanaBrazilBrunei DarussalamBulgariaBurkina FasoBurundiCabo VerdeCambodiaCameroonCanadaCaribbean small statesCentral African RepublicCentral Europe and the BalticsChadChileChinaColombiaComorosCongo, Dem. Rep.Congo, Rep.Costa RicaCote d'IvoireCroatiaCubaCyprusDenmarkDjiboutiDominicaDominican RepublicEarly-demographic dividendEast Asia & PacificEast Asia & Pacific (excluding high income)East Asia & Pacific (IDA & IBRD countries)EcuadorEgypt, Arab Rep.El SalvadorEquatorial GuineaEritreaEstoniaEthiopiaEuro areaEurope & Central AsiaEurope & Central Asia (excluding high income)Europe & Central Asia (IDA & IBRD countries)European UnionFijiFinlandFragile and conflict affected situationsFranceGabonGambia, TheGeorgiaGhanaGreeceGrenadaGuatemalaGuineaGuinea-BissauGuyanaHaitiHeavily indebted poor countries (HIPC)High incomeHondurasHong Kong SAR, ChinaHungaryIBRD onlyIcelandIDA & IBRD totalIDA blendIDA onlyIDA totalIndiaIndonesiaIran, Islamic Rep.IraqIrelandIsraelItalyJamaicaJapanJordanKazakhstanKenyaKiribatiKorea, Dem. People’s Rep.Korea, Rep.KuwaitKyrgyz RepublicLao PDRLate-demographic dividendLatin America & Caribbean Latin America & Caribbean (excluding high income)Latin America & the Caribbean (IDA & IBRD countries)LatviaLeast developed countries: UN classificationLebanonLesothoLiberiaLibyaLiechtensteinLithuaniaLow & middle incomeLow incomeLower middle incomeLuxembourgMacao SAR, ChinaMacedonia, FYRMadagascarMalawiMaldivesMaliMaltaMarshall IslandsMauritaniaMauritiusMexicoMicronesia, Fed. Sts.Middle East & North AfricaMiddle East & North Africa (excluding high income)Middle East & North Africa (IDA & IBRD countries)Middle incomeMoldovaMongoliaMontenegroMoroccoMozambiqueMyanmarNamibiaNauruNepalNetherlandsNew ZealandNicaraguaNigerNigeriaNorth AmericaNorwayOECD membersOmanOther small statesPacific island small statesPakistanPanamaPapua New GuineaParaguayPeruPhilippinesPolandPortugalPost-demographic dividendPre-demographic dividendPuerto RicoQatarRomaniaRussian FederationRwandaSamoaSan MarinoSao Tome and PrincipeSaudi ArabiaSenegalSerbiaSeychellesSierra LeoneSloveniaSmall statesSolomon IslandsSomaliaSouth AfricaSouth AsiaSouth Asia (IDA & IBRD)South SudanSpainSri LankaSt. Kitts and NevisSt. LuciaSt. Vincent and the GrenadinesSub-Saharan Africa Sub-Saharan Africa (excluding high income)Sub-Saharan Africa (IDA & IBRD countries)SudanSurinameSwazilandSwedenSwitzerlandSyrian Arab RepublicTajikistanTanzaniaThailandTimor-LesteTogoTongaTrinidad and TobagoTunisiaTurkeyTuvaluUgandaUkraineUnited Arab EmiratesUnited KingdomUnited StatesUpper middle incomeUruguayUzbekistanVanuatuVenezuela, RBWest Bank and GazaWorldYemen, Rep.ZambiaZimbabwe Timeline:
This timeline shows a graph from 1972 to 2014 of Australia. No data until 1971. Number of actual observations by date: 38.
Source name:
World Development Indicators
Source organization:
United Nations Educational, Scientific, and Cultural Organization (UNESCO) Institute for Statistics.
Categories, topics:
Education, Gender
Last updated:
apr 23, 2017
Indicators value changes by year
Minimum:
94.568
jan 1, 1975
Maximum:
99.337
jan 1, 1982
At the date of observation
Value
Absolute change
Change from previous value
jan 1, 1972
96.319
+96.319
0.0%
jan 1, 1974
95.211
-1.107
-1.15%
jan 1, 1975
94.568
-0.643
-0.68%
jan 1, 1976
96.94
+2.372
2.51%
jan 1, 1977
97.732
+0.792
0.82%
jan 1, 1982
99.337
+1.605
1.64%
jan 1, 1983
98.33
-1.007
-1.01%
jan 1, 1984
97.209
-1.121
-1.14%
jan 1, 1985
95.539
-1.67
-1.72%
jan 1, 1986
95.876
+0.337
0.35%
jan 1, 1987
96.707
+0.831
0.87%
jan 1, 1988
97.392
+0.685
0.71%
jan 1, 1989
98.152
+0.76
0.78%
jan 1, 1990
98.269
+0.117
0.12%
jan 1, 1991
97.758
-0.512
-0.52%
jan 1, 1992
97.162
-0.595
-0.61%
jan 1, 1993
96.932
-0.23
-0.24%
jan 1, 1994
96.504
-0.429
-0.44%
jan 1, 1995
96.228
-0.276
-0.29%
jan 1, 1996
94.802
-1.426
-1.48%
jan 1, 1997
95.336
+0.534
0.56%
jan 1, 1998
95.114
-0.222
-0.23%
jan 1, 1999
95.247
+0.133
0.14%
jan 1, 2000
95.261
+0.014
0.02%
jan 1, 2001
95.5
+0.239
0.25%
jan 1, 2002
95.478
-0.022
-0.02%
jan 1, 2003
95.43
-0.048
-0.05%
jan 1, 2004
95.973
+0.543
0.57%
jan 1, 2005
96.259
+0.286
0.3%
jan 1, 2006
96.574
+0.314
0.33%
jan 1, 2007
96.793
+0.219
0.23%
jan 1, 2008
97.396
+0.604
0.62%
jan 1, 2009
97.441
+0.044
0.05%
jan 1, 2010
97.365
-0.075
-0.08%
jan 1, 2011
97.498
+0.132
0.14%
jan 1, 2012
98.033
+0.535
0.55%
jan 1, 2013
97.802
-0.231
-0.24%
jan 1, 2014
97.531
-0.27
-0.28%
Ranking of countries by current statistics by years


Comments: