29
/
en
AIzaSyAYiBZKx7MnpbEhh9jyipgxe19OcubqV5w
April 1, 2024
214881
Norway
NOR
true
2
1
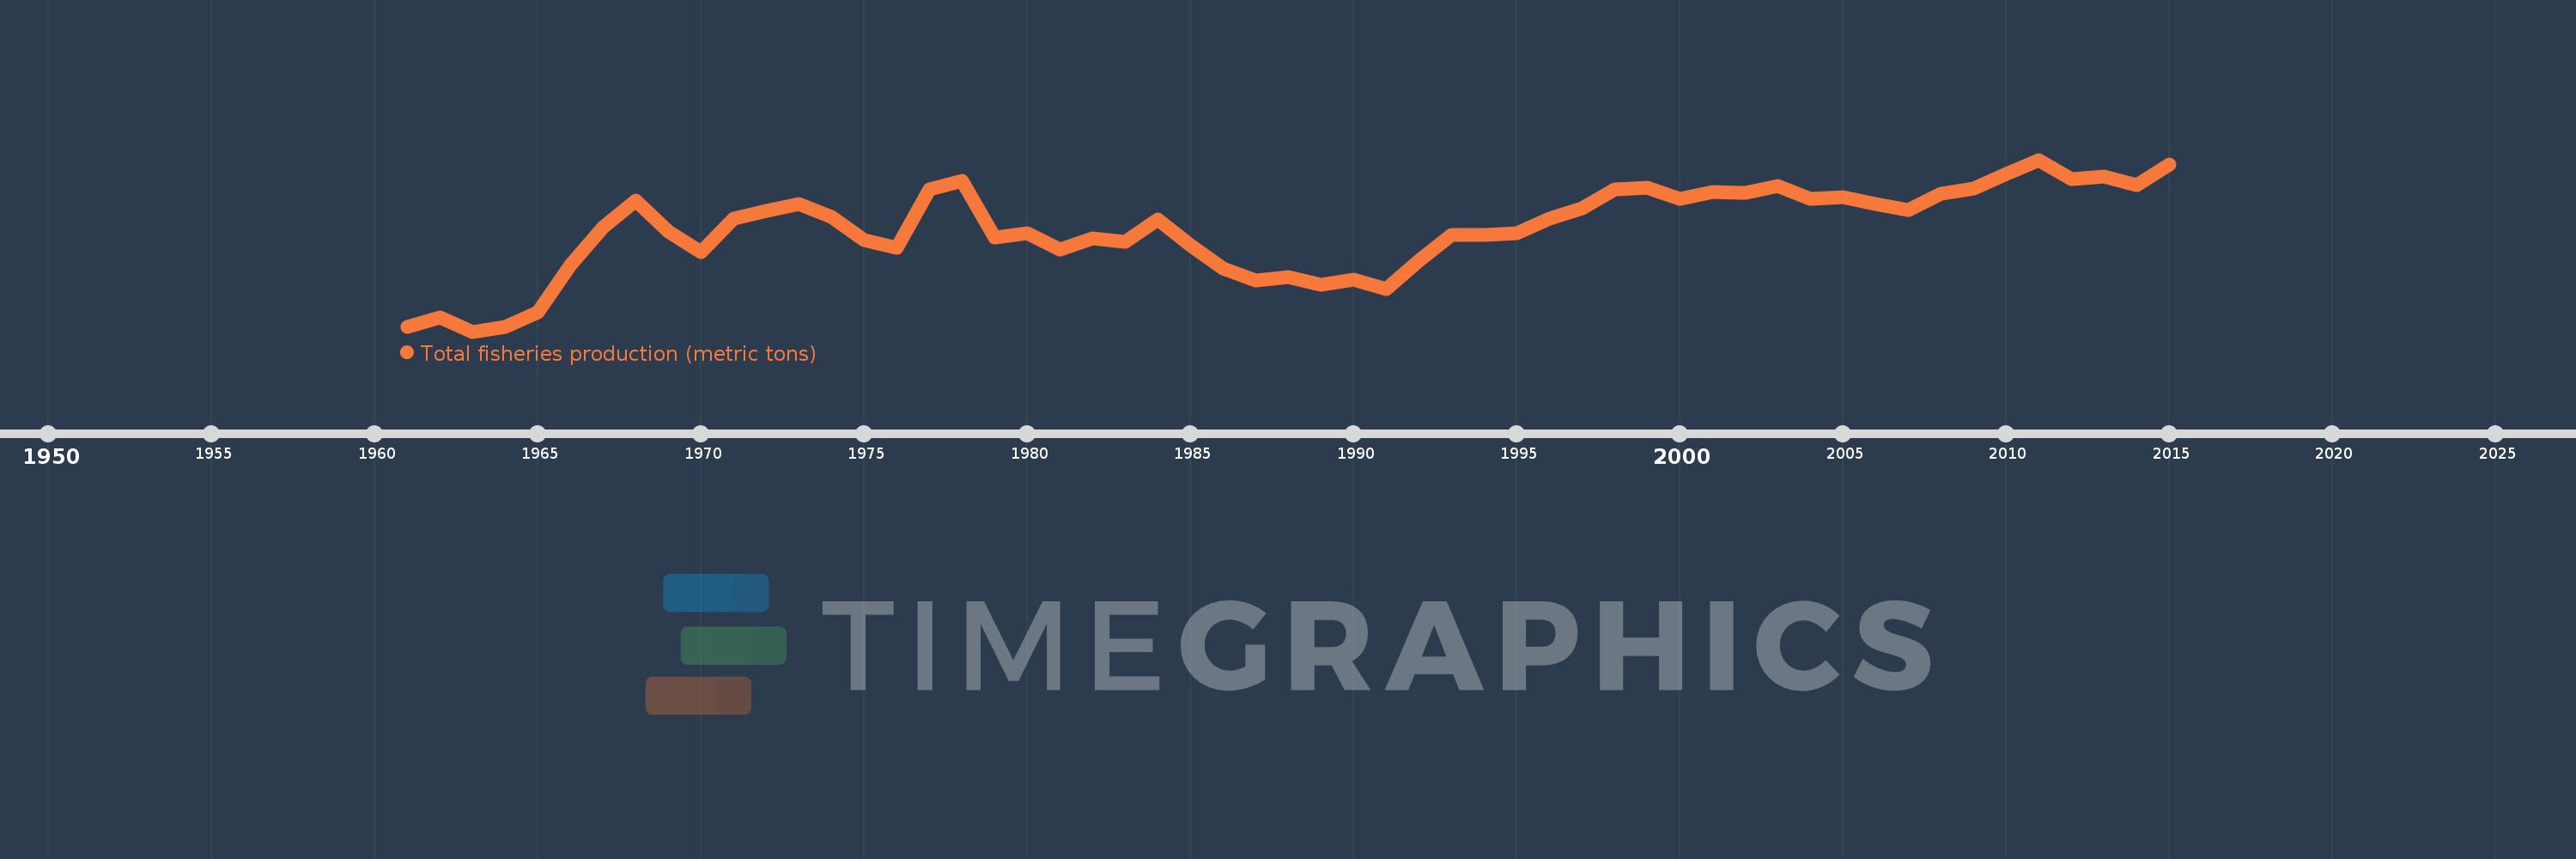
Total fisheries production (metric tons)
2015,2014,2013,2012,2011,2010,2009,2008,2007,2006,2005,2004,2003,2002,2001,2000,1999,1998,1997,1996,1995,1994,1993,1992,1991,1990,1989,1988,1987,1986,1985,1984,1983,1982,1981,1980,1979,1978,1977,1976,1975,1974,1973,1972,1971,1970,1969,1968,1967,1966,1965,1964,1963,1962,1961
This statistics in other country:
AfghanistanAlbaniaAlgeriaAmerican SamoaAngolaAntigua and BarbudaArab WorldArgentinaArmeniaArubaAustraliaAustriaAzerbaijanBahamas, TheBahrainBangladeshBarbadosBelarusBelgiumBelizeBeninBermudaBhutanBoliviaBosnia and HerzegovinaBotswanaBrazilBritish Virgin IslandsBrunei DarussalamBulgariaBurkina FasoBurundiCabo VerdeCambodiaCameroonCanadaCaribbean small statesCayman IslandsCentral African RepublicCentral Europe and the BalticsChadChannel IslandsChileChinaColombiaComorosCongo, Dem. Rep.Congo, Rep.Costa RicaCote d'IvoireCroatiaCubaCuracaoCyprusCzech RepublicDenmarkDjiboutiDominicaDominican RepublicEarly-demographic dividendEast Asia & PacificEast Asia & Pacific (excluding high income)East Asia & Pacific (IDA & IBRD countries)EcuadorEgypt, Arab Rep.El SalvadorEquatorial GuineaEritreaEstoniaEthiopiaEuro areaEurope & Central AsiaEurope & Central Asia (excluding high income)Europe & Central Asia (IDA & IBRD countries)European UnionFaroe IslandsFijiFinlandFragile and conflict affected situationsFranceFrench PolynesiaGabonGambia, TheGeorgiaGermanyGhanaGreeceGreenlandGrenadaGuamGuatemalaGuineaGuinea-BissauGuyanaHaitiHeavily indebted poor countries (HIPC)High incomeHondurasHong Kong SAR, ChinaHungaryIBRD onlyIcelandIDA & IBRD totalIDA blendIDA onlyIDA totalIndiaIndonesiaIran, Islamic Rep.IraqIrelandIsle of ManIsraelItalyJamaicaJapanJordanKazakhstanKenyaKiribatiKorea, Dem. People’s Rep.Korea, Rep.KuwaitKyrgyz RepublicLao PDRLate-demographic dividendLatin America & Caribbean Latin America & Caribbean (excluding high income)Latin America & the Caribbean (IDA & IBRD countries)LatviaLeast developed countries: UN classificationLebanonLesothoLiberiaLibyaLithuaniaLow & middle incomeLow incomeLower middle incomeMacao SAR, ChinaMacedonia, FYRMadagascarMalawiMalaysiaMaldivesMaliMaltaMarshall IslandsMauritaniaMauritiusMexicoMicronesia, Fed. Sts.Middle East & North AfricaMiddle East & North Africa (excluding high income)Middle East & North Africa (IDA & IBRD countries)Middle incomeMoldovaMonacoMongoliaMontenegroMoroccoMozambiqueMyanmarNamibiaNauruNepalNetherlandsNew CaledoniaNew ZealandNicaraguaNigerNigeriaNorth AmericaNorthern Mariana IslandsNorwayOECD membersOmanOther small statesPacific island small statesPakistanPalauPanamaPapua New GuineaParaguayPeruPhilippinesPolandPortugalPost-demographic dividendPre-demographic dividendPuerto RicoQatarRomaniaRussian FederationRwandaSamoaSao Tome and PrincipeSaudi ArabiaSenegalSerbiaSeychellesSierra LeoneSingaporeSint Maarten (Dutch part)Slovak RepublicSloveniaSmall statesSolomon IslandsSomaliaSouth AfricaSouth AsiaSouth Asia (IDA & IBRD)South SudanSpainSri LankaSt. Kitts and NevisSt. LuciaSt. Martin (French part)St. Vincent and the GrenadinesSub-Saharan Africa Sub-Saharan Africa (excluding high income)Sub-Saharan Africa (IDA & IBRD countries)SudanSurinameSwazilandSwedenSwitzerlandSyrian Arab RepublicTajikistanTanzaniaThailandTimor-LesteTogoTongaTrinidad and TobagoTunisiaTurkeyTurkmenistanTurks and Caicos IslandsTuvaluUgandaUkraineUnited Arab EmiratesUnited KingdomUnited StatesUpper middle incomeUruguayUzbekistanVanuatuVenezuela, RBVietnamVirgin Islands (U.S.)West Bank and GazaWorldYemen, Rep.ZambiaZimbabwe Timeline:
This timeline shows a graph from 1961 to 2015 of Norway. No data until 1960. Number of actual observations by date: 55.
Source name:
World Development Indicators
Source organization:
Food and Agriculture Organization.
Categories, topics:
Environment
Last updated:
apr 23, 2017
Indicators value changes by year
Minimum:
1.321 mln
jan 1, 1963
Maximum:
3.858 mln
jan 1, 2011
At the date of observation
Value
Absolute change
Change from previous value
jan 1, 1961
1.388 mln
+1.388 mln
0.0%
jan 1, 1962
1.527 mln
+138.868K
10.0%
jan 1, 1963
1.321 mln
-205.7K
-13.47%
jan 1, 1964
1.388 mln
+66.502K
5.03%
jan 1, 1965
1.608 mln
+220.179K
15.87%
jan 1, 1966
2.309 mln
+700.852K
43.59%
jan 1, 1967
2.867 mln
+558.256K
24.18%
jan 1, 1968
3.251 mln
+383.782K
13.39%
jan 1, 1969
2.804 mln
-446.468K
-13.73%
jan 1, 1970
2.491 mln
-313.423K
-11.18%
jan 1, 1971
2.983 mln
+492.107K
19.76%
jan 1, 1972
3.103 mln
+119.919K
4.02%
jan 1, 1973
3.205 mln
+101.944K
3.29%
jan 1, 1974
3.016 mln
-188.829K
-5.89%
jan 1, 1975
2.671 mln
-345.058K
-11.44%
jan 1, 1976
2.555 mln
-115.619K
-4.33%
jan 1, 1977
3.42 mln
+864.943K
33.85%
jan 1, 1978
3.546 mln
+125.943K
3.68%
jan 1, 1979
2.715 mln
-831.321K
-23.44%
jan 1, 1980
2.768 mln
+53.399K
1.97%
jan 1, 1981
2.536 mln
-232.645K
-8.4%
jan 1, 1982
2.7 mln
+164.567K
6.49%
jan 1, 1983
2.65 mln
-50.131K
-1.86%
jan 1, 1984
2.972 mln
+322.223K
12.16%
jan 1, 1985
2.602 mln
-370.67K
-12.47%
jan 1, 1986
2.252 mln
-349.526K
-13.43%
jan 1, 1987
2.074 mln
-178.629K
-7.93%
jan 1, 1988
2.123 mln
+48.998K
2.36%
jan 1, 1989
2.01 mln
-112.283K
-5.29%
jan 1, 1990
2.093 mln
+82.436K
4.1%
jan 1, 1991
1.951 mln
-142.233K
-6.8%
jan 1, 1992
2.363 mln
+412.864K
21.17%
jan 1, 1993
2.751 mln
+387.829K
16.41%
jan 1, 1994
2.749 mln
-1.982K
-0.07%
jan 1, 1995
2.77 mln
+20.434K
0.74%
jan 1, 1996
2.987 mln
+217.089K
7.84%
jan 1, 1997
3.143 mln
+156.375K
5.24%
jan 1, 1998
3.422 mln
+279.223K
8.88%
jan 1, 1999
3.452 mln
+29.385K
0.86%
jan 1, 2000
3.282 mln
-169.734K
-4.92%
jan 1, 2001
3.383 mln
+101.112K
3.08%
jan 1, 2002
3.373 mln
-10.22K
-0.3%
jan 1, 2003
3.474 mln
+101.513K
3.01%
jan 1, 2004
3.286 mln
-187.978K
-5.41%
jan 1, 2005
3.31 mln
+23.066K
0.7%
jan 1, 2006
3.208 mln
-101.124K
-3.06%
jan 1, 2007
3.114 mln
-94.223K
-2.94%
jan 1, 2008
3.356 mln
+242.065K
7.77%
jan 1, 2009
3.434 mln
+77.338K
2.3%
jan 1, 2010
3.655 mln
+221.107K
6.44%
jan 1, 2011
3.858 mln
+203.572K
5.57%
jan 1, 2012
3.579 mln
-279.659K
-7.25%
jan 1, 2013
3.612 mln
+33.837K
0.95%
jan 1, 2014
3.481 mln
-131.061K
-3.63%
jan 1, 2015
3.788 mln
+306.983K
8.82%
Ranking of countries by current statistics by years


Comments: