29
/
en
AIzaSyAYiBZKx7MnpbEhh9jyipgxe19OcubqV5w
April 1, 2024
266407
Tonga
TON
true
2
1
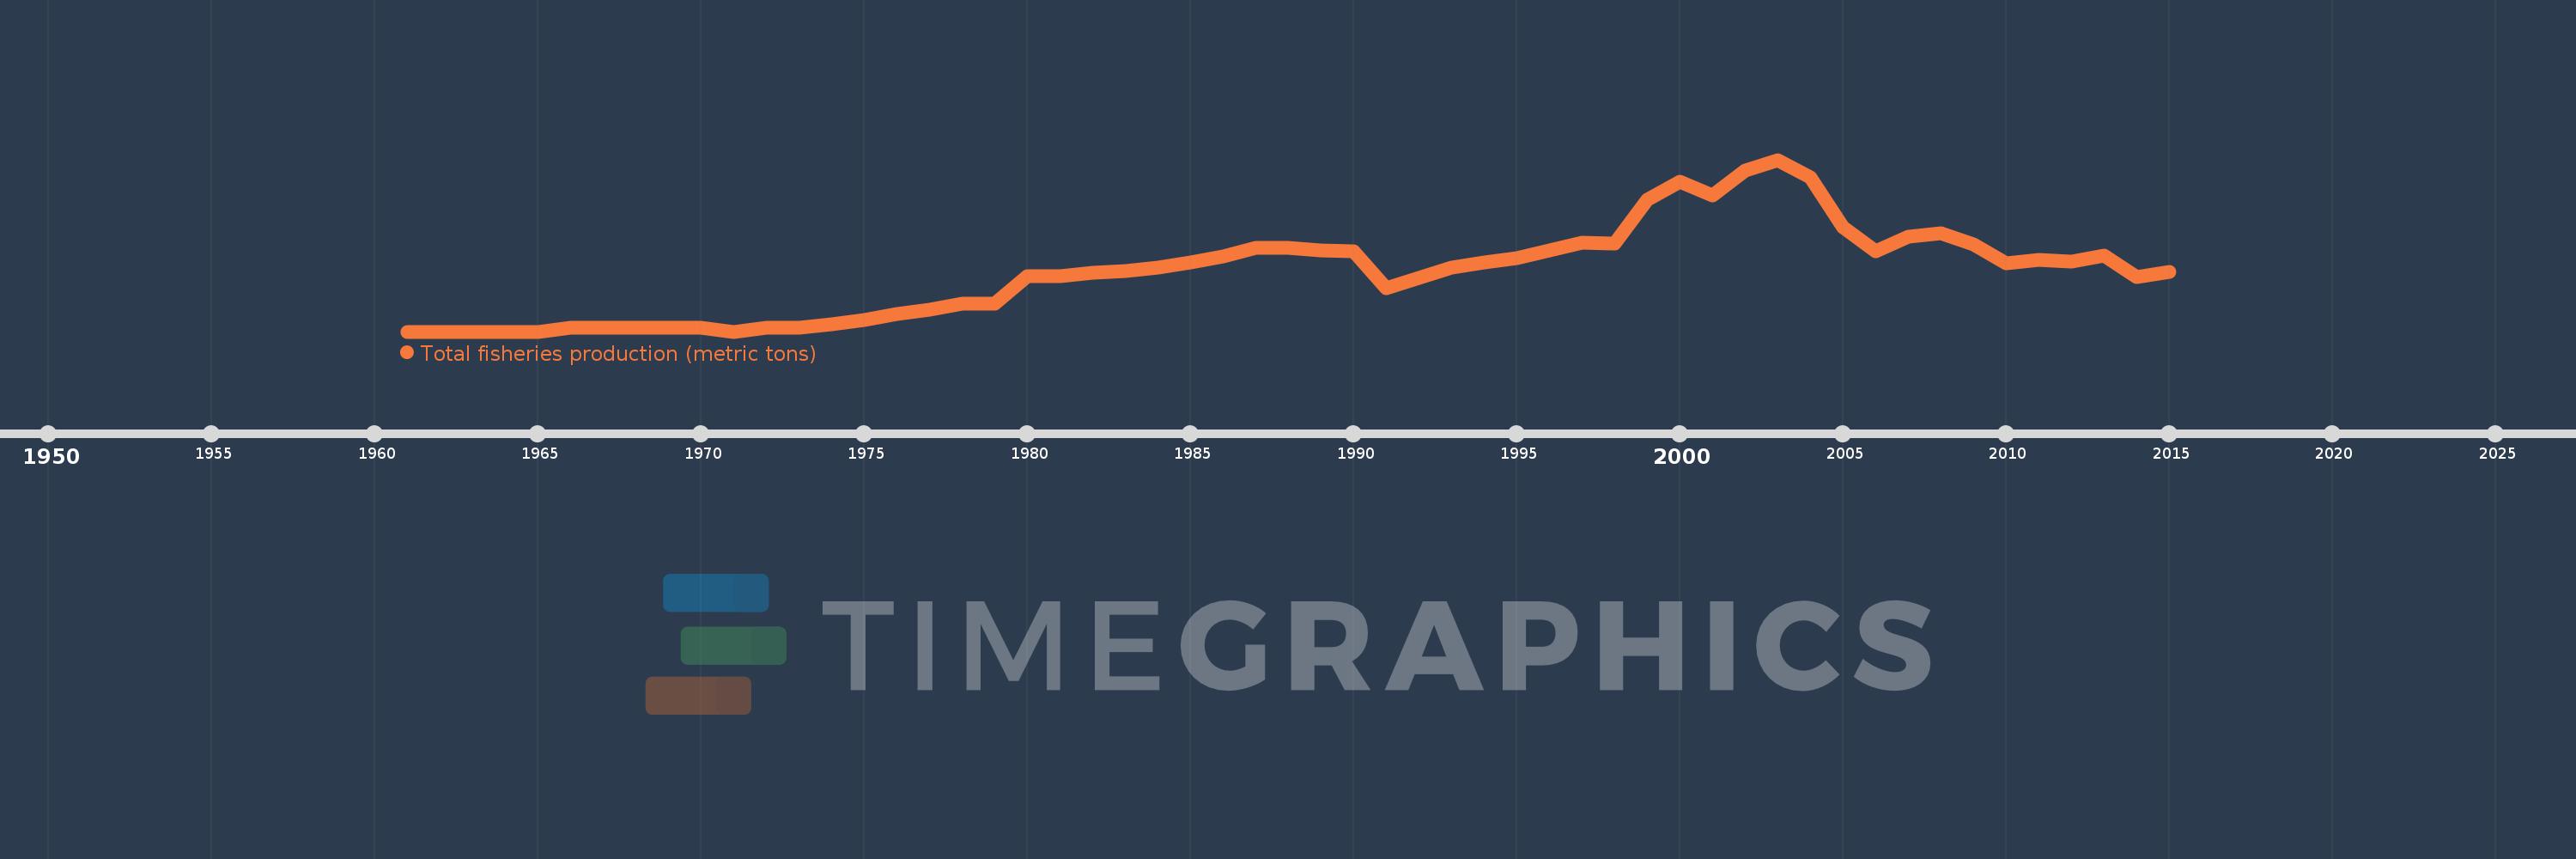
Total fisheries production (metric tons)
2015,2014,2013,2012,2011,2010,2009,2008,2007,2006,2005,2004,2003,2002,2001,2000,1999,1998,1997,1996,1995,1994,1993,1992,1991,1990,1989,1988,1987,1986,1985,1984,1983,1982,1981,1980,1979,1978,1977,1976,1975,1974,1973,1972,1971,1970,1969,1968,1967,1966,1965,1964,1963,1962,1961
This statistics in other country:
AfghanistanAlbaniaAlgeriaAmerican SamoaAngolaAntigua and BarbudaArab WorldArgentinaArmeniaArubaAustraliaAustriaAzerbaijanBahamas, TheBahrainBangladeshBarbadosBelarusBelgiumBelizeBeninBermudaBhutanBoliviaBosnia and HerzegovinaBotswanaBrazilBritish Virgin IslandsBrunei DarussalamBulgariaBurkina FasoBurundiCabo VerdeCambodiaCameroonCanadaCaribbean small statesCayman IslandsCentral African RepublicCentral Europe and the BalticsChadChannel IslandsChileChinaColombiaComorosCongo, Dem. Rep.Congo, Rep.Costa RicaCote d'IvoireCroatiaCubaCuracaoCyprusCzech RepublicDenmarkDjiboutiDominicaDominican RepublicEarly-demographic dividendEast Asia & PacificEast Asia & Pacific (excluding high income)East Asia & Pacific (IDA & IBRD countries)EcuadorEgypt, Arab Rep.El SalvadorEquatorial GuineaEritreaEstoniaEthiopiaEuro areaEurope & Central AsiaEurope & Central Asia (excluding high income)Europe & Central Asia (IDA & IBRD countries)European UnionFaroe IslandsFijiFinlandFragile and conflict affected situationsFranceFrench PolynesiaGabonGambia, TheGeorgiaGermanyGhanaGreeceGreenlandGrenadaGuamGuatemalaGuineaGuinea-BissauGuyanaHaitiHeavily indebted poor countries (HIPC)High incomeHondurasHong Kong SAR, ChinaHungaryIBRD onlyIcelandIDA & IBRD totalIDA blendIDA onlyIDA totalIndiaIndonesiaIran, Islamic Rep.IraqIrelandIsle of ManIsraelItalyJamaicaJapanJordanKazakhstanKenyaKiribatiKorea, Dem. People’s Rep.Korea, Rep.KuwaitKyrgyz RepublicLao PDRLate-demographic dividendLatin America & Caribbean Latin America & Caribbean (excluding high income)Latin America & the Caribbean (IDA & IBRD countries)LatviaLeast developed countries: UN classificationLebanonLesothoLiberiaLibyaLithuaniaLow & middle incomeLow incomeLower middle incomeMacao SAR, ChinaMacedonia, FYRMadagascarMalawiMalaysiaMaldivesMaliMaltaMarshall IslandsMauritaniaMauritiusMexicoMicronesia, Fed. Sts.Middle East & North AfricaMiddle East & North Africa (excluding high income)Middle East & North Africa (IDA & IBRD countries)Middle incomeMoldovaMonacoMongoliaMontenegroMoroccoMozambiqueMyanmarNamibiaNauruNepalNetherlandsNew CaledoniaNew ZealandNicaraguaNigerNigeriaNorth AmericaNorthern Mariana IslandsNorwayOECD membersOmanOther small statesPacific island small statesPakistanPalauPanamaPapua New GuineaParaguayPeruPhilippinesPolandPortugalPost-demographic dividendPre-demographic dividendPuerto RicoQatarRomaniaRussian FederationRwandaSamoaSao Tome and PrincipeSaudi ArabiaSenegalSerbiaSeychellesSierra LeoneSingaporeSint Maarten (Dutch part)Slovak RepublicSloveniaSmall statesSolomon IslandsSomaliaSouth AfricaSouth AsiaSouth Asia (IDA & IBRD)South SudanSpainSri LankaSt. Kitts and NevisSt. LuciaSt. Martin (French part)St. Vincent and the GrenadinesSub-Saharan Africa Sub-Saharan Africa (excluding high income)Sub-Saharan Africa (IDA & IBRD countries)SudanSurinameSwazilandSwedenSwitzerlandSyrian Arab RepublicTajikistanTanzaniaThailandTimor-LesteTogoTongaTrinidad and TobagoTunisiaTurkeyTurkmenistanTurks and Caicos IslandsTuvaluUgandaUkraineUnited Arab EmiratesUnited KingdomUnited StatesUpper middle incomeUruguayUzbekistanVanuatuVenezuela, RBVietnamVirgin Islands (U.S.)West Bank and GazaWorldYemen, Rep.ZambiaZimbabwe Timeline:
This timeline shows a graph from 1961 to 2015 of Tonga. No data until 1960. Number of actual observations by date: 55.
Source name:
World Development Indicators
Source organization:
Food and Agriculture Organization.
Categories, topics:
Environment
Last updated:
apr 23, 2017
Indicators value changes by year
Maximum:
5.327K
jan 1, 2003
At the date of observation
Value
Absolute change
Change from previous value
jan 1, 1961
400.0
+400.0
0.0%
jan 1, 1962
400.0
0.0
0.0%
jan 1, 1963
400.0
0.0
0.0%
jan 1, 1964
400.0
0.0
0.0%
jan 1, 1965
400.0
0.0
0.0%
jan 1, 1966
500.0
+100.0
25.0%
jan 1, 1967
500.0
0.0
0.0%
jan 1, 1968
500.0
0.0
0.0%
jan 1, 1969
500.0
0.0
0.0%
jan 1, 1970
500.0
0.0
0.0%
jan 1, 1971
400.0
-100.0
-20.0%
jan 1, 1972
500.0
+100.0
25.0%
jan 1, 1973
500.0
0.0
0.0%
jan 1, 1974
600.0
+100.0
20.0%
jan 1, 1975
726.0
+126.0
21.0%
jan 1, 1976
901.0
+175.0
24.1%
jan 1, 1977
1.019K
+118.0
13.1%
jan 1, 1978
1.197K
+178.0
17.47%
jan 1, 1979
1.21K
+13.0
1.09%
jan 1, 1980
2.0K
+790.0
65.29%
jan 1, 1981
1.994K
-6.0
-0.3%
jan 1, 1982
2.093K
+99.0
4.96%
jan 1, 1983
2.134K
+41.0
1.96%
jan 1, 1984
2.237K
+103.0
4.83%
jan 1, 1985
2.385K
+148.0
6.62%
jan 1, 1986
2.561K
+176.0
7.38%
jan 1, 1987
2.814K
+253.0
9.88%
jan 1, 1988
2.79K
-24.0
-0.85%
jan 1, 1989
2.731K
-59.0
-2.11%
jan 1, 1990
2.699K
-32.0
-1.17%
jan 1, 1991
1.644K
-1.055K
-39.09%
jan 1, 1992
1.935K
+291.0
17.7%
jan 1, 1993
2.237K
+302.0
15.61%
jan 1, 1994
2.375K
+138.0
6.17%
jan 1, 1995
2.499K
+124.0
5.22%
jan 1, 1996
2.727K
+228.0
9.12%
jan 1, 1997
2.955K
+228.0
8.36%
jan 1, 1998
2.924K
-31.0
-1.05%
jan 1, 1999
4.172K
+1.248K
42.68%
jan 1, 2000
4.698K
+526.0
12.61%
jan 1, 2001
4.308K
-390.0
-8.3%
jan 1, 2002
5.017K
+709.0
16.46%
jan 1, 2003
5.327K
+310.0
6.18%
jan 1, 2004
4.826K
-501.0
-9.4%
jan 1, 2005
3.385K
-1.441K
-29.86%
jan 1, 2006
2.701K
-684.0
-20.21%
jan 1, 2007
3.111K
+410.0
15.18%
jan 1, 2008
3.216K
+104.5
3.36%
jan 1, 2009
2.896K
-319.89
-9.95%
jan 1, 2010
2.352K
-543.41
-18.77%
jan 1, 2011
2.451K
+99.1
4.21%
jan 1, 2012
2.405K
-46.0
-1.88%
jan 1, 2013
2.586K
+180.7
7.51%
jan 1, 2014
1.96K
-625.96
-24.21%
jan 1, 2015
2.104K
+144.27
7.36%
Ranking of countries by current statistics by years


Comments: