29
/
en
AIzaSyAYiBZKx7MnpbEhh9jyipgxe19OcubqV5w
April 1, 2024
29564
East Asia & Pacific (IDA & IBRD countries)
TEA
false
2
1
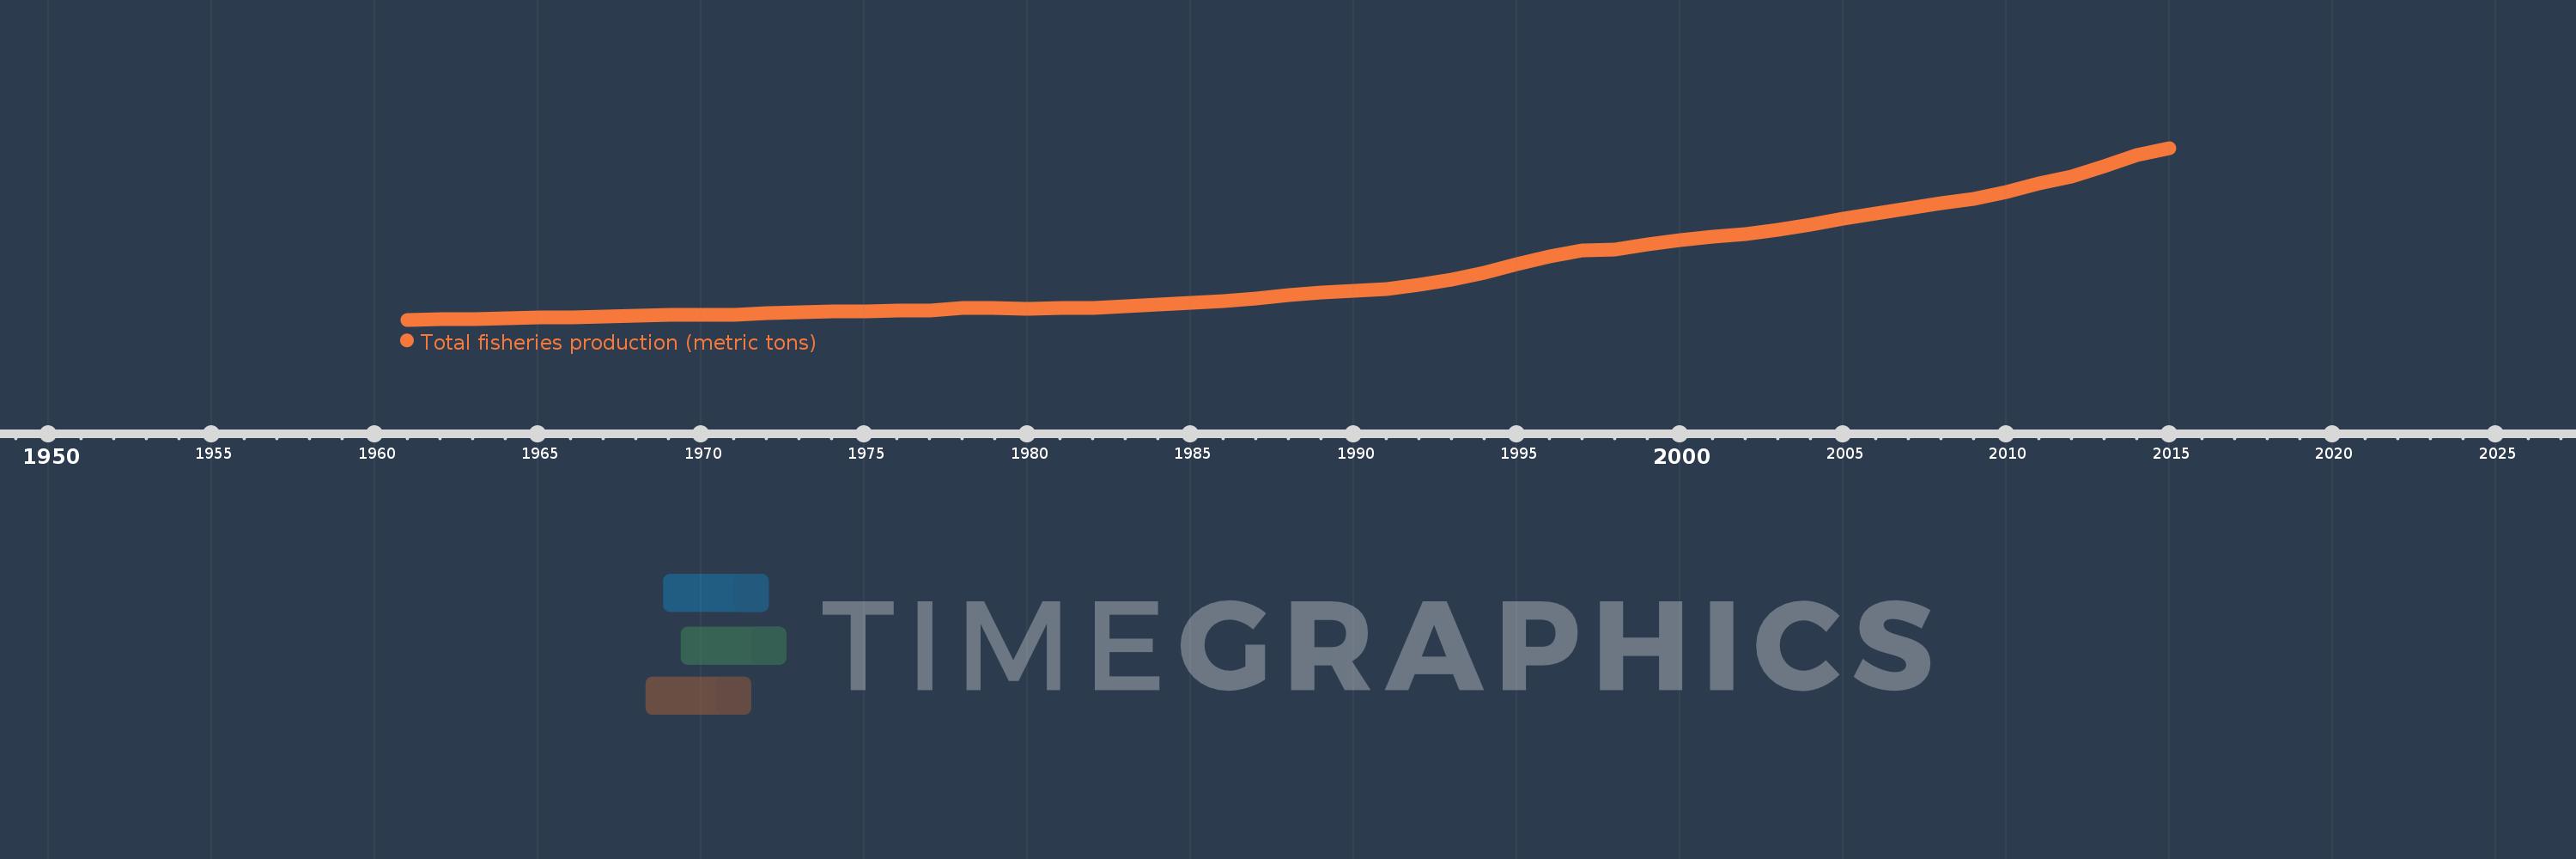
Total fisheries production (metric tons)
2015,2014,2013,2012,2011,2010,2009,2008,2007,2006,2005,2004,2003,2002,2001,2000,1999,1998,1997,1996,1995,1994,1993,1992,1991,1990,1989,1988,1987,1986,1985,1984,1983,1982,1981,1980,1979,1978,1977,1976,1975,1974,1973,1972,1971,1970,1969,1968,1967,1966,1965,1964,1963,1962,1961
This statistics in other country:
AfghanistanAlbaniaAlgeriaAmerican SamoaAngolaAntigua and BarbudaArab WorldArgentinaArmeniaArubaAustraliaAustriaAzerbaijanBahamas, TheBahrainBangladeshBarbadosBelarusBelgiumBelizeBeninBermudaBhutanBoliviaBosnia and HerzegovinaBotswanaBrazilBritish Virgin IslandsBrunei DarussalamBulgariaBurkina FasoBurundiCabo VerdeCambodiaCameroonCanadaCaribbean small statesCayman IslandsCentral African RepublicCentral Europe and the BalticsChadChannel IslandsChileChinaColombiaComorosCongo, Dem. Rep.Congo, Rep.Costa RicaCote d'IvoireCroatiaCubaCuracaoCyprusCzech RepublicDenmarkDjiboutiDominicaDominican RepublicEarly-demographic dividendEast Asia & PacificEast Asia & Pacific (excluding high income)East Asia & Pacific (IDA & IBRD countries)EcuadorEgypt, Arab Rep.El SalvadorEquatorial GuineaEritreaEstoniaEthiopiaEuro areaEurope & Central AsiaEurope & Central Asia (excluding high income)Europe & Central Asia (IDA & IBRD countries)European UnionFaroe IslandsFijiFinlandFragile and conflict affected situationsFranceFrench PolynesiaGabonGambia, TheGeorgiaGermanyGhanaGreeceGreenlandGrenadaGuamGuatemalaGuineaGuinea-BissauGuyanaHaitiHeavily indebted poor countries (HIPC)High incomeHondurasHong Kong SAR, ChinaHungaryIBRD onlyIcelandIDA & IBRD totalIDA blendIDA onlyIDA totalIndiaIndonesiaIran, Islamic Rep.IraqIrelandIsle of ManIsraelItalyJamaicaJapanJordanKazakhstanKenyaKiribatiKorea, Dem. People’s Rep.Korea, Rep.KuwaitKyrgyz RepublicLao PDRLate-demographic dividendLatin America & Caribbean Latin America & Caribbean (excluding high income)Latin America & the Caribbean (IDA & IBRD countries)LatviaLeast developed countries: UN classificationLebanonLesothoLiberiaLibyaLithuaniaLow & middle incomeLow incomeLower middle incomeMacao SAR, ChinaMacedonia, FYRMadagascarMalawiMalaysiaMaldivesMaliMaltaMarshall IslandsMauritaniaMauritiusMexicoMicronesia, Fed. Sts.Middle East & North AfricaMiddle East & North Africa (excluding high income)Middle East & North Africa (IDA & IBRD countries)Middle incomeMoldovaMonacoMongoliaMontenegroMoroccoMozambiqueMyanmarNamibiaNauruNepalNetherlandsNew CaledoniaNew ZealandNicaraguaNigerNigeriaNorth AmericaNorthern Mariana IslandsNorwayOECD membersOmanOther small statesPacific island small statesPakistanPalauPanamaPapua New GuineaParaguayPeruPhilippinesPolandPortugalPost-demographic dividendPre-demographic dividendPuerto RicoQatarRomaniaRussian FederationRwandaSamoaSao Tome and PrincipeSaudi ArabiaSenegalSerbiaSeychellesSierra LeoneSingaporeSint Maarten (Dutch part)Slovak RepublicSloveniaSmall statesSolomon IslandsSomaliaSouth AfricaSouth AsiaSouth Asia (IDA & IBRD)South SudanSpainSri LankaSt. Kitts and NevisSt. LuciaSt. Martin (French part)St. Vincent and the GrenadinesSub-Saharan Africa Sub-Saharan Africa (excluding high income)Sub-Saharan Africa (IDA & IBRD countries)SudanSurinameSwazilandSwedenSwitzerlandSyrian Arab RepublicTajikistanTanzaniaThailandTimor-LesteTogoTongaTrinidad and TobagoTunisiaTurkeyTurkmenistanTurks and Caicos IslandsTuvaluUgandaUkraineUnited Arab EmiratesUnited KingdomUnited StatesUpper middle incomeUruguayUzbekistanVanuatuVenezuela, RBVietnamVirgin Islands (U.S.)West Bank and GazaWorldYemen, Rep.ZambiaZimbabwe Timeline:
This timeline shows a graph from 1961 to 2015 of East Asia & Pacific (IDA & IBRD countries). No data until 1960. Number of actual observations by date: 55.
Source name:
World Development Indicators
Source organization:
Food and Agriculture Organization.
Categories, topics:
Environment
Last updated:
apr 23, 2017
Indicators value changes by year
Minimum:
5.642 mln
jan 1, 1961
Maximum:
119.433 mln
jan 1, 2015
At the date of observation
Value
Absolute change
Change from previous value
jan 1, 1961
5.642 mln
+5.642 mln
0.0%
jan 1, 1962
5.904 mln
+262.64K
4.66%
jan 1, 1963
6.207 mln
+303.181K
5.14%
jan 1, 1964
6.504 mln
+296.703K
4.78%
jan 1, 1965
6.897 mln
+392.852K
6.04%
jan 1, 1966
7.336 mln
+438.837K
6.36%
jan 1, 1967
7.796 mln
+460.123K
6.27%
jan 1, 1968
8.064 mln
+267.752K
3.43%
jan 1, 1969
8.63 mln
+566.583K
7.03%
jan 1, 1970
8.987 mln
+357.099K
4.14%
jan 1, 1971
9.101 mln
+113.651K
1.26%
jan 1, 1972
9.909 mln
+808.276K
8.88%
jan 1, 1973
10.69 mln
+780.622K
7.88%
jan 1, 1974
10.892 mln
+202.358K
1.89%
jan 1, 1975
11.124 mln
+232.285K
2.13%
jan 1, 1976
11.468 mln
+343.033K
3.08%
jan 1, 1977
11.812 mln
+344.615K
3.01%
jan 1, 1978
13.226 mln
+1.414 mln
11.97%
jan 1, 1979
13.353 mln
+126.813K
0.96%
jan 1, 1980
12.921 mln
-431.983K
-3.24%
jan 1, 1981
13.256 mln
+335.574K
2.6%
jan 1, 1982
13.72 mln
+464.191K
3.5%
jan 1, 1983
14.612 mln
+891.377K
6.5%
jan 1, 1984
15.928 mln
+1.316 mln
9.01%
jan 1, 1985
16.717 mln
+789.7K
4.96%
jan 1, 1986
18.026 mln
+1.308 mln
7.82%
jan 1, 1987
19.922 mln
+1.896 mln
10.52%
jan 1, 1988
21.918 mln
+1.996 mln
10.02%
jan 1, 1989
23.436 mln
+1.519 mln
6.93%
jan 1, 1990
24.929 mln
+1.492 mln
6.37%
jan 1, 1991
26.229 mln
+1.3 mln
5.22%
jan 1, 1992
28.59 mln
+2.361 mln
9.0%
jan 1, 1993
32.488 mln
+3.899 mln
13.64%
jan 1, 1994
36.98 mln
+4.491 mln
13.82%
jan 1, 1995
42.224 mln
+5.244 mln
14.18%
jan 1, 1996
47.464 mln
+5.241 mln
12.41%
jan 1, 1997
51.328 mln
+3.864 mln
8.14%
jan 1, 1998
52.285 mln
+956.891K
1.86%
jan 1, 1999
55.337 mln
+3.052 mln
5.84%
jan 1, 2000
58.302 mln
+2.965 mln
5.36%
jan 1, 2001
60.685 mln
+2.383 mln
4.09%
jan 1, 2002
62.44 mln
+1.755 mln
2.89%
jan 1, 2003
65.357 mln
+2.916 mln
4.67%
jan 1, 2004
68.559 mln
+3.203 mln
4.9%
jan 1, 2005
72.765 mln
+4.206 mln
6.13%
jan 1, 2006
75.888 mln
+3.123 mln
4.29%
jan 1, 2007
79.31 mln
+3.422 mln
4.51%
jan 1, 2008
82.673 mln
+3.362 mln
4.24%
jan 1, 2009
85.56 mln
+2.888 mln
3.49%
jan 1, 2010
90.162 mln
+4.601 mln
5.38%
jan 1, 2011
95.693 mln
+5.531 mln
6.13%
jan 1, 2012
100.584 mln
+4.891 mln
5.11%
jan 1, 2013
107.394 mln
+6.81 mln
6.77%
jan 1, 2014
114.811 mln
+7.417 mln
6.91%
jan 1, 2015
119.433 mln
+4.622 mln
4.03%
Ranking of countries by current statistics by years


Comments: