29
/
en
AIzaSyAYiBZKx7MnpbEhh9jyipgxe19OcubqV5w
April 1, 2024
268799
Tunisia
TUN
true
2
1
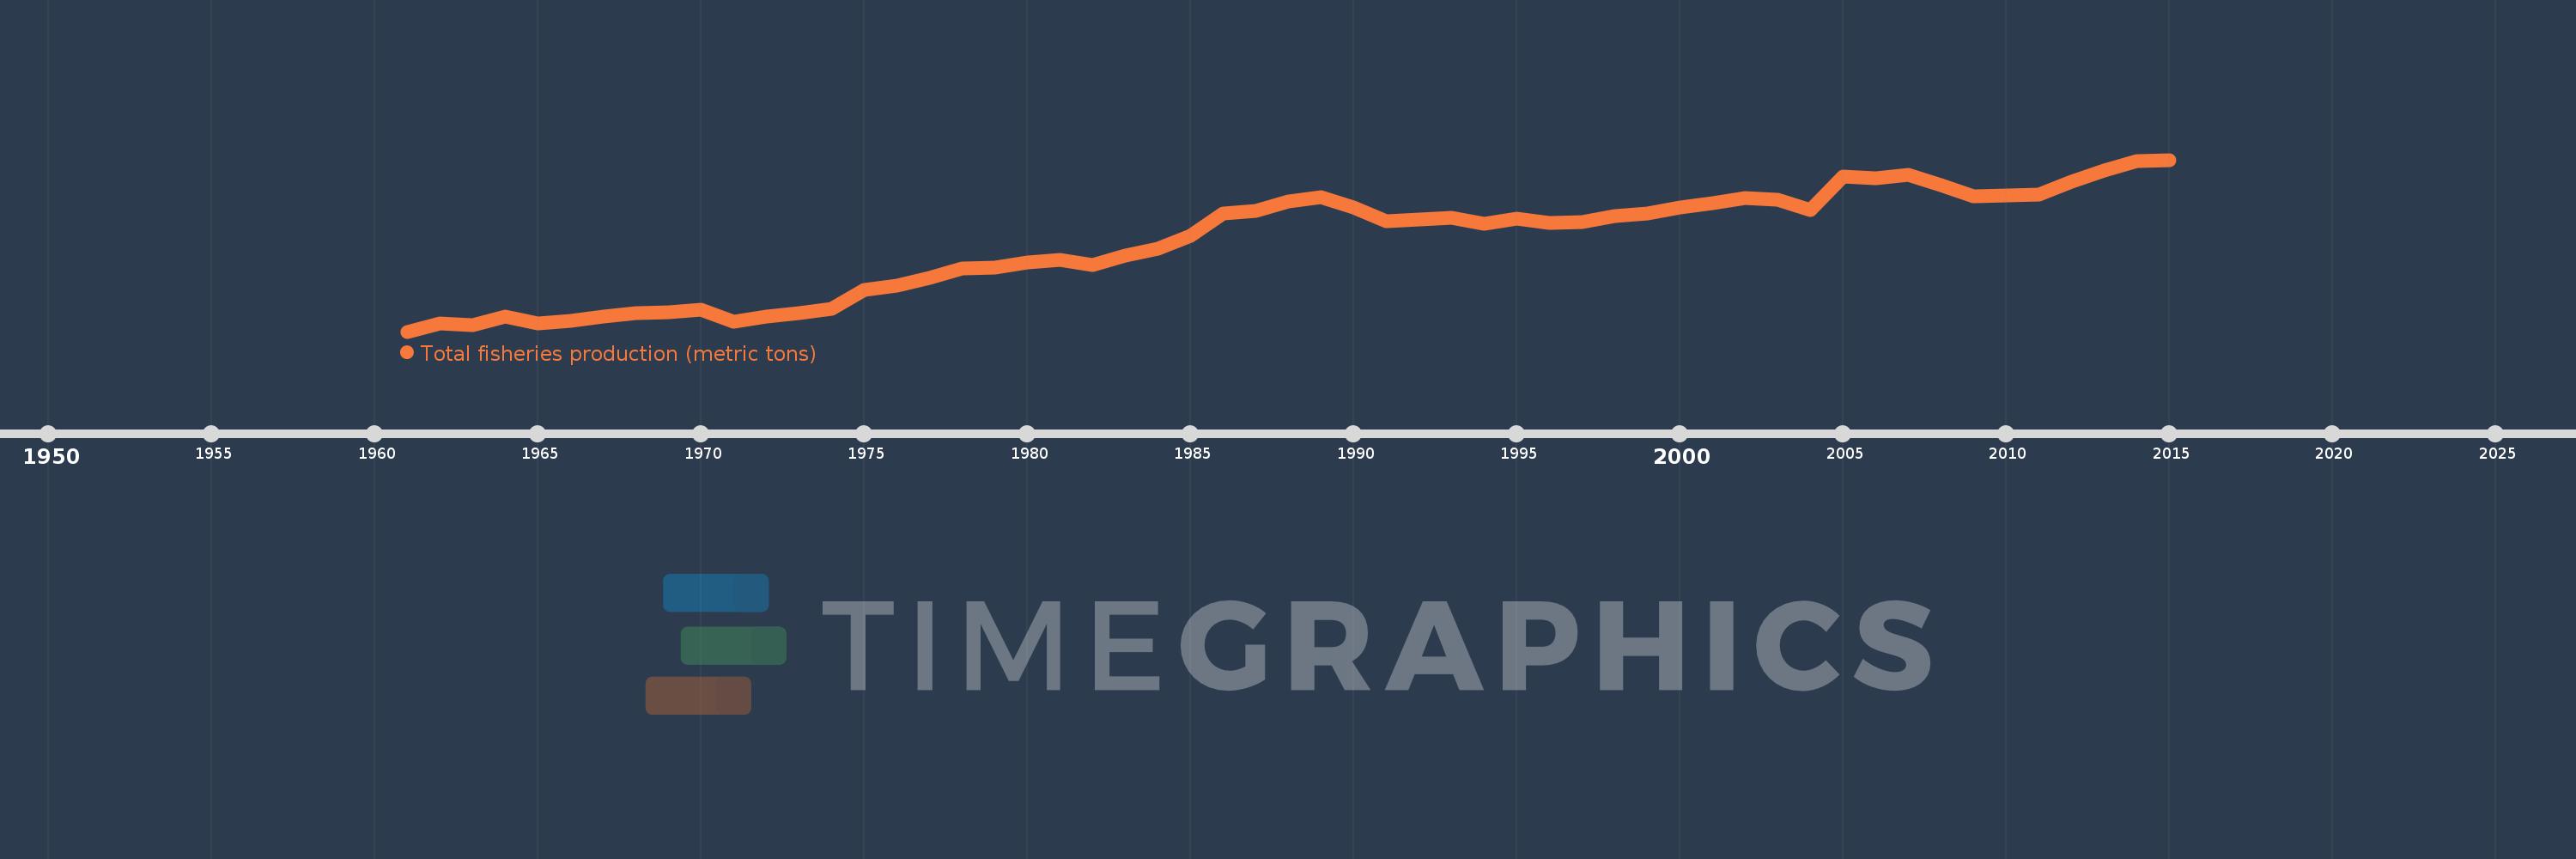
Total fisheries production (metric tons)
2015,2014,2013,2012,2011,2010,2009,2008,2007,2006,2005,2004,2003,2002,2001,2000,1999,1998,1997,1996,1995,1994,1993,1992,1991,1990,1989,1988,1987,1986,1985,1984,1983,1982,1981,1980,1979,1978,1977,1976,1975,1974,1973,1972,1971,1970,1969,1968,1967,1966,1965,1964,1963,1962,1961
This statistics in other country:
AfghanistanAlbaniaAlgeriaAmerican SamoaAngolaAntigua and BarbudaArab WorldArgentinaArmeniaArubaAustraliaAustriaAzerbaijanBahamas, TheBahrainBangladeshBarbadosBelarusBelgiumBelizeBeninBermudaBhutanBoliviaBosnia and HerzegovinaBotswanaBrazilBritish Virgin IslandsBrunei DarussalamBulgariaBurkina FasoBurundiCabo VerdeCambodiaCameroonCanadaCaribbean small statesCayman IslandsCentral African RepublicCentral Europe and the BalticsChadChannel IslandsChileChinaColombiaComorosCongo, Dem. Rep.Congo, Rep.Costa RicaCote d'IvoireCroatiaCubaCuracaoCyprusCzech RepublicDenmarkDjiboutiDominicaDominican RepublicEarly-demographic dividendEast Asia & PacificEast Asia & Pacific (excluding high income)East Asia & Pacific (IDA & IBRD countries)EcuadorEgypt, Arab Rep.El SalvadorEquatorial GuineaEritreaEstoniaEthiopiaEuro areaEurope & Central AsiaEurope & Central Asia (excluding high income)Europe & Central Asia (IDA & IBRD countries)European UnionFaroe IslandsFijiFinlandFragile and conflict affected situationsFranceFrench PolynesiaGabonGambia, TheGeorgiaGermanyGhanaGreeceGreenlandGrenadaGuamGuatemalaGuineaGuinea-BissauGuyanaHaitiHeavily indebted poor countries (HIPC)High incomeHondurasHong Kong SAR, ChinaHungaryIBRD onlyIcelandIDA & IBRD totalIDA blendIDA onlyIDA totalIndiaIndonesiaIran, Islamic Rep.IraqIrelandIsle of ManIsraelItalyJamaicaJapanJordanKazakhstanKenyaKiribatiKorea, Dem. People’s Rep.Korea, Rep.KuwaitKyrgyz RepublicLao PDRLate-demographic dividendLatin America & Caribbean Latin America & Caribbean (excluding high income)Latin America & the Caribbean (IDA & IBRD countries)LatviaLeast developed countries: UN classificationLebanonLesothoLiberiaLibyaLithuaniaLow & middle incomeLow incomeLower middle incomeMacao SAR, ChinaMacedonia, FYRMadagascarMalawiMalaysiaMaldivesMaliMaltaMarshall IslandsMauritaniaMauritiusMexicoMicronesia, Fed. Sts.Middle East & North AfricaMiddle East & North Africa (excluding high income)Middle East & North Africa (IDA & IBRD countries)Middle incomeMoldovaMonacoMongoliaMontenegroMoroccoMozambiqueMyanmarNamibiaNauruNepalNetherlandsNew CaledoniaNew ZealandNicaraguaNigerNigeriaNorth AmericaNorthern Mariana IslandsNorwayOECD membersOmanOther small statesPacific island small statesPakistanPalauPanamaPapua New GuineaParaguayPeruPhilippinesPolandPortugalPost-demographic dividendPre-demographic dividendPuerto RicoQatarRomaniaRussian FederationRwandaSamoaSao Tome and PrincipeSaudi ArabiaSenegalSerbiaSeychellesSierra LeoneSingaporeSint Maarten (Dutch part)Slovak RepublicSloveniaSmall statesSolomon IslandsSomaliaSouth AfricaSouth AsiaSouth Asia (IDA & IBRD)South SudanSpainSri LankaSt. Kitts and NevisSt. LuciaSt. Martin (French part)St. Vincent and the GrenadinesSub-Saharan Africa Sub-Saharan Africa (excluding high income)Sub-Saharan Africa (IDA & IBRD countries)SudanSurinameSwazilandSwedenSwitzerlandSyrian Arab RepublicTajikistanTanzaniaThailandTimor-LesteTogoTongaTrinidad and TobagoTunisiaTurkeyTurkmenistanTurks and Caicos IslandsTuvaluUgandaUkraineUnited Arab EmiratesUnited KingdomUnited StatesUpper middle incomeUruguayUzbekistanVanuatuVenezuela, RBVietnamVirgin Islands (U.S.)West Bank and GazaWorldYemen, Rep.ZambiaZimbabwe Timeline:
This timeline shows a graph from 1961 to 2015 of Tunisia. No data until 1960. Number of actual observations by date: 55.
Source name:
World Development Indicators
Source organization:
Food and Agriculture Organization.
Categories, topics:
Environment
Last updated:
apr 23, 2017
Indicators value changes by year
Minimum:
16.65K
jan 1, 1961
Maximum:
123.326K
jan 1, 2015
At the date of observation
Value
Absolute change
Change from previous value
jan 1, 1961
16.65K
+16.65K
0.0%
jan 1, 1962
21.8K
+5.15K
30.93%
jan 1, 1963
20.804K
-996.0
-4.57%
jan 1, 1964
26.06K
+5.256K
25.26%
jan 1, 1965
21.676K
-4.384K
-16.82%
jan 1, 1966
23.201K
+1.525K
7.04%
jan 1, 1967
26.193K
+2.992K
12.9%
jan 1, 1968
28.207K
+2.014K
7.69%
jan 1, 1969
28.484K
+277.0
0.98%
jan 1, 1970
30.127K
+1.643K
5.77%
jan 1, 1971
22.66K
-7.467K
-24.79%
jan 1, 1972
25.87K
+3.21K
14.17%
jan 1, 1973
28.289K
+2.419K
9.35%
jan 1, 1974
30.674K
+2.385K
8.43%
jan 1, 1975
42.347K
+11.673K
38.06%
jan 1, 1976
45.273K
+2.926K
6.91%
jan 1, 1977
50.033K
+4.76K
10.51%
jan 1, 1978
55.738K
+5.705K
11.4%
jan 1, 1979
56.425K
+686.8
1.23%
jan 1, 1980
59.749K
+3.324K
5.89%
jan 1, 1981
61.123K
+1.374K
2.3%
jan 1, 1982
58.068K
-3.056K
-5.0%
jan 1, 1983
63.806K
+5.739K
9.88%
jan 1, 1984
68.111K
+4.305K
6.75%
jan 1, 1985
75.855K
+7.744K
11.37%
jan 1, 1986
89.826K
+13.97K
18.42%
jan 1, 1987
91.403K
+1.577K
1.76%
jan 1, 1988
97.716K
+6.314K
6.91%
jan 1, 1989
100.176K
+2.46K
2.52%
jan 1, 1990
93.938K
-6.239K
-6.23%
jan 1, 1991
85.237K
-8.701K
-9.26%
jan 1, 1992
86.514K
+1.277K
1.5%
jan 1, 1993
87.347K
+833.448
0.96%
jan 1, 1994
83.417K
-3.93K
-4.5%
jan 1, 1995
86.947K
+3.53K
4.23%
jan 1, 1996
84.216K
-2.731K
-3.14%
jan 1, 1997
84.885K
+669.295
0.79%
jan 1, 1998
88.265K
+3.38K
3.98%
jan 1, 1999
89.94K
+1.674K
1.9%
jan 1, 2000
93.49K
+3.551K
3.95%
jan 1, 2001
96.224K
+2.734K
2.92%
jan 1, 2002
99.394K
+3.17K
3.29%
jan 1, 2003
98.708K
-686.526
-0.69%
jan 1, 2004
92.348K
-6.359K
-6.44%
jan 1, 2005
112.68K
+20.332K
22.02%
jan 1, 2006
111.756K
-923.358
-0.82%
jan 1, 2007
114.25K
+2.493K
2.23%
jan 1, 2008
107.402K
-6.847K
-5.99%
jan 1, 2009
100.772K
-6.63K
-6.17%
jan 1, 2010
101.168K
+396.06
0.39%
jan 1, 2011
101.664K
+495.991
0.49%
jan 1, 2012
109.47K
+7.806K
7.68%
jan 1, 2013
116.74K
+7.27K
6.64%
jan 1, 2014
122.592K
+5.852K
5.01%
jan 1, 2015
123.326K
+734.1
0.6%
Ranking of countries by current statistics by years


Comments: