29
/
en
AIzaSyAYiBZKx7MnpbEhh9jyipgxe19OcubqV5w
April 1, 2024
208599
New Caledonia
NCL
true
2
1
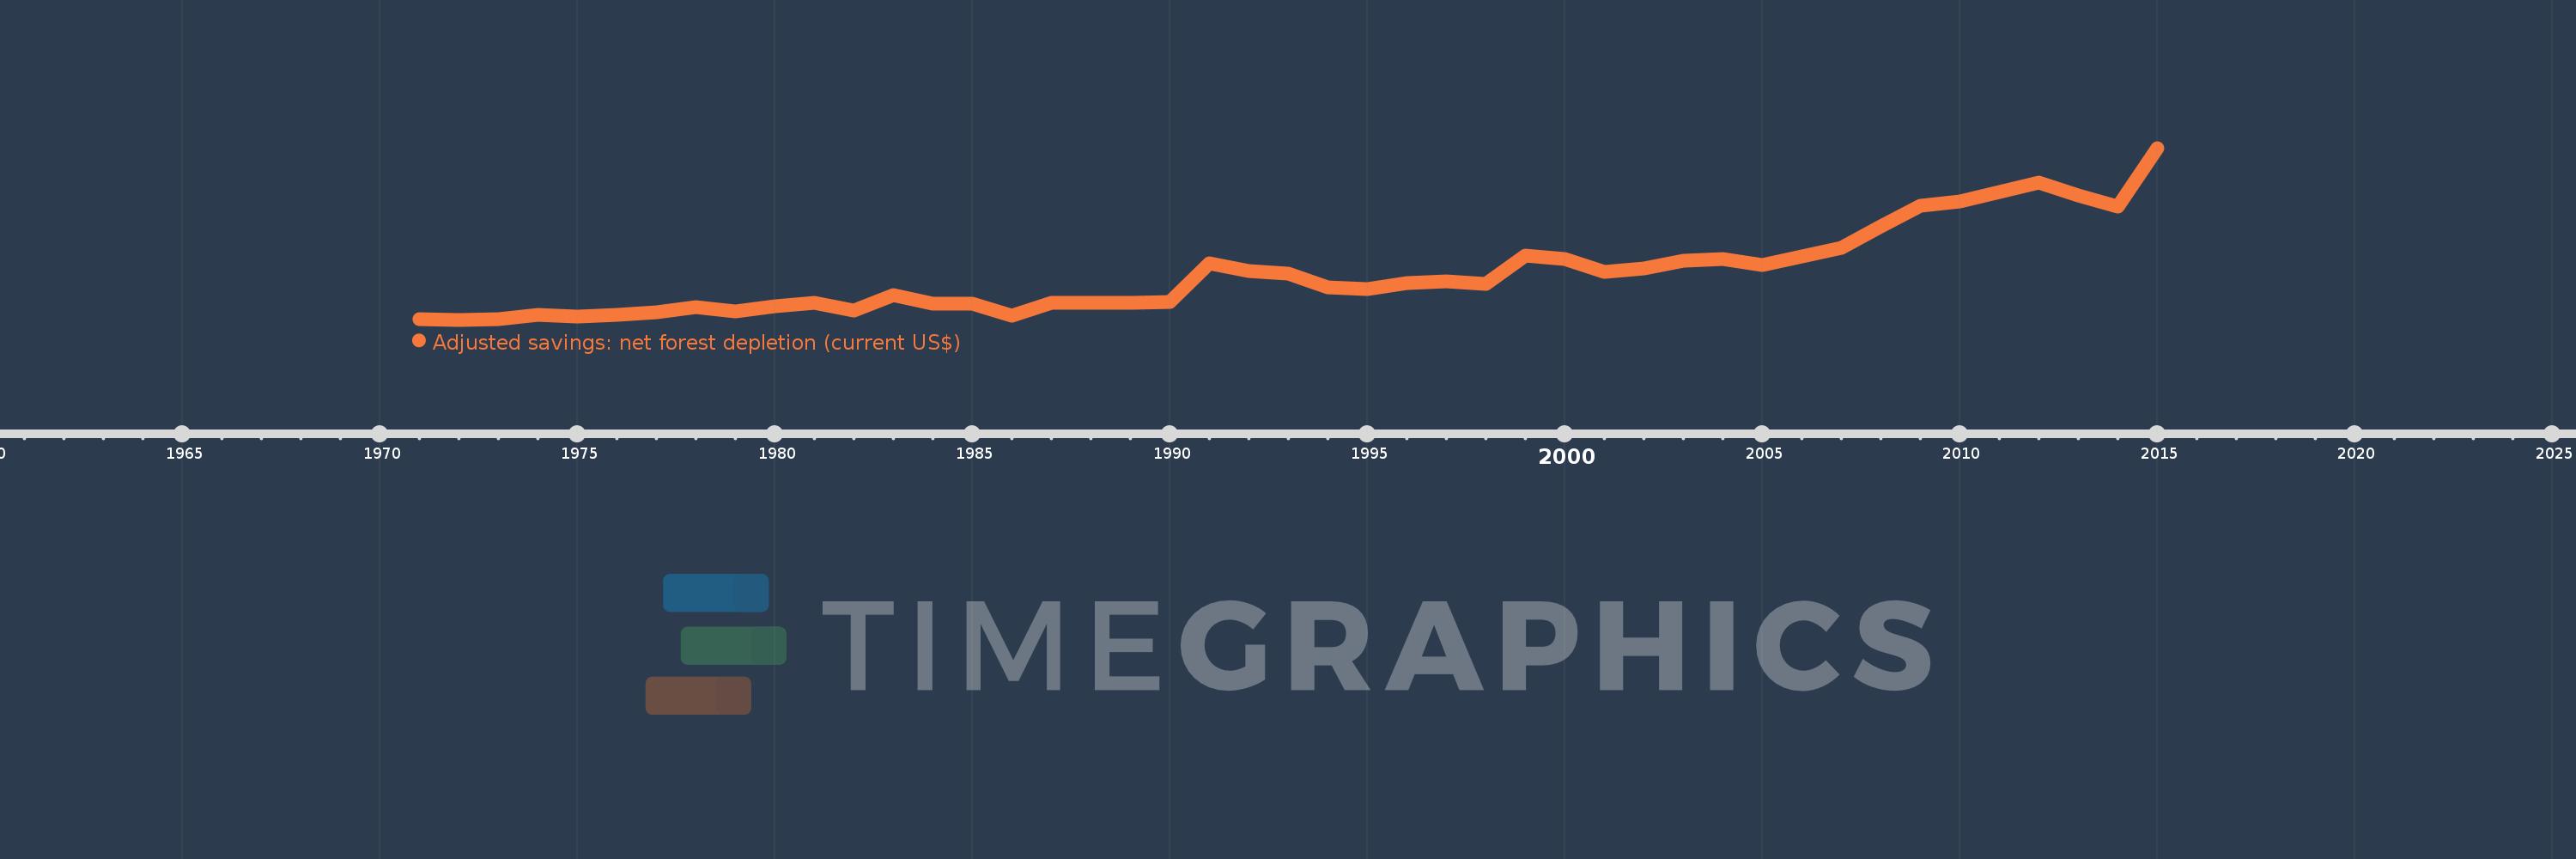
Adjusted savings: net forest depletion (current US$)
2015,2014,2013,2012,2011,2010,2009,2008,2007,2006,2005,2004,2003,2002,2001,2000,1999,1998,1997,1996,1995,1994,1993,1992,1991,1990,1989,1988,1987,1986,1985,1984,1983,1982,1981,1980,1979,1978,1977,1976,1975,1974,1973,1972,1971
This statistics in other country:
AfghanistanAlbaniaAlgeriaAngolaArgentinaArmeniaAustraliaAustriaAzerbaijanBahamas, TheBahrainBangladeshBarbadosBelarusBelgiumBelizeBeninBhutanBoliviaBotswanaBrazilBrunei DarussalamBulgariaBurkina FasoBurundiCabo VerdeCambodiaCameroonCanadaCentral African RepublicChadChileChinaColombiaComorosCongo, Dem. Rep.Congo, Rep.Costa RicaCote d'IvoireCroatiaCubaCyprusCzech RepublicDenmarkDjiboutiDominicaDominican RepublicEcuadorEgypt, Arab Rep.El SalvadorEquatorial GuineaEritreaEstoniaEthiopiaFijiFinlandFranceFrench PolynesiaGabonGambia, TheGeorgiaGermanyGhanaGreeceGuatemalaGuineaGuinea-BissauGuyanaHaitiHondurasHong Kong SAR, ChinaHungaryIcelandIndiaIndonesiaIran, Islamic Rep.IraqIrelandIsraelItalyJamaicaJapanJordanKazakhstanKenyaKiribatiKorea, Dem. People’s Rep.Korea, Rep.KuwaitKyrgyz RepublicLao PDRLatviaLebanonLesothoLiberiaLibyaLithuaniaLuxembourgMacao SAR, ChinaMacedonia, FYRMadagascarMalawiMalaysiaMaldivesMaliMauritaniaMauritiusMexicoMicronesia, Fed. Sts.MoldovaMongoliaMoroccoMozambiqueMyanmarNamibiaNepalNetherlandsNew CaledoniaNew ZealandNicaraguaNigerNigeriaNorwayOmanPakistanPanamaPapua New GuineaParaguayPeruPhilippinesPolandPortugalQatarRomaniaRussian FederationRwandaSamoaSao Tome and PrincipeSaudi ArabiaSenegalSeychellesSierra LeoneSingaporeSlovak RepublicSloveniaSolomon IslandsSomaliaSouth AfricaSpainSri LankaSt. LuciaSt. Vincent and the GrenadinesSudanSurinameSwazilandSwedenSwitzerlandSyrian Arab RepublicTajikistanTanzaniaThailandTogoTongaTrinidad and TobagoTunisiaTurkeyTurkmenistanUgandaUkraineUnited Arab EmiratesUnited KingdomUnited StatesUruguayUzbekistanVanuatuVenezuela, RBVietnamYemen, Rep.ZambiaZimbabwe Timeline:
This timeline shows a graph from 1971 to 2015 of New Caledonia. No data until 1970. Number of actual observations by date: 45.
Source name:
World Development Indicators
Source organization:
World Bank staff estimates based on sources and methods in World Bank's "The Changing Wealth of Nations: Measuring Sustainable Development in the New Millennium" (2011).
Categories, topics:
Economy & Growth, Environment
Last updated:
apr 23, 2017
Indicators value changes by year
Minimum:
24.309K
jan 1, 1972
Maximum:
1.853 mln
jan 1, 2015
At the date of observation
Value
Absolute change
Change from previous value
jan 1, 1971
31.128K
+31.128K
0.0%
jan 1, 1972
24.309K
-6.82K
-21.91%
jan 1, 1973
30.492K
+6.184K
25.44%
jan 1, 1974
76.201K
+45.709K
149.9%
jan 1, 1975
61.913K
-14.288K
-18.75%
jan 1, 1976
73.985K
+12.072K
19.5%
jan 1, 1977
102.006K
+28.021K
37.87%
jan 1, 1978
158.05K
+56.044K
54.94%
jan 1, 1979
111.901K
-46.149K
-29.2%
jan 1, 1980
170.301K
+58.4K
52.19%
jan 1, 1981
208.736K
+38.434K
22.57%
jan 1, 1982
119.458K
-89.278K
-42.77%
jan 1, 1983
284.564K
+165.107K
138.21%
jan 1, 1984
194.18K
-90.384K
-31.76%
jan 1, 1985
197.094K
+2.914K
1.5%
jan 1, 1986
69.691K
-127.403K
-64.64%
jan 1, 1987
200.256K
+130.565K
187.35%
jan 1, 1988
203.937K
+3.682K
1.84%
jan 1, 1989
205.406K
+1.468K
0.72%
jan 1, 1990
209.087K
+3.682K
1.79%
jan 1, 1991
627.507K
+418.42K
200.12%
jan 1, 1992
541.522K
-85.985K
-13.7%
jan 1, 1993
511.129K
-30.394K
-5.61%
jan 1, 1994
368.182K
-142.947K
-27.97%
jan 1, 1995
348.303K
-19.879K
-5.4%
jan 1, 1996
413.39K
+65.086K
18.69%
jan 1, 1997
435.423K
+22.034K
5.33%
jan 1, 1998
406.306K
-29.117K
-6.69%
jan 1, 1999
705.291K
+298.985K
73.59%
jan 1, 2000
671.963K
-33.328K
-4.73%
jan 1, 2001
533.004K
-138.958K
-20.68%
jan 1, 2002
569.306K
+36.302K
6.81%
jan 1, 2003
654.751K
+85.444K
15.01%
jan 1, 2004
673.725K
+18.974K
2.9%
jan 1, 2005
603.706K
-70.018K
-10.39%
jan 1, 2006
694.408K
+90.702K
15.02%
jan 1, 2007
792.99K
+98.582K
14.2%
jan 1, 2008
1.016 mln
+222.802K
28.1%
jan 1, 2009
1.24 mln
+224.266K
22.08%
jan 1, 2010
1.285 mln
+45.073K
3.63%
jan 1, 2011
1.384 mln
+98.399K
7.66%
jan 1, 2012
1.484 mln
+100.321K
7.25%
jan 1, 2013
1.343 mln
-140.389K
-9.46%
jan 1, 2014
1.229 mln
-114.897K
-8.55%
jan 1, 2015
1.853 mln
+624.042K
50.79%
Ranking of countries by current statistics by years


Comments: