29
/
en
AIzaSyAYiBZKx7MnpbEhh9jyipgxe19OcubqV5w
April 1, 2024
227132
Qatar
QAT
true
2
1
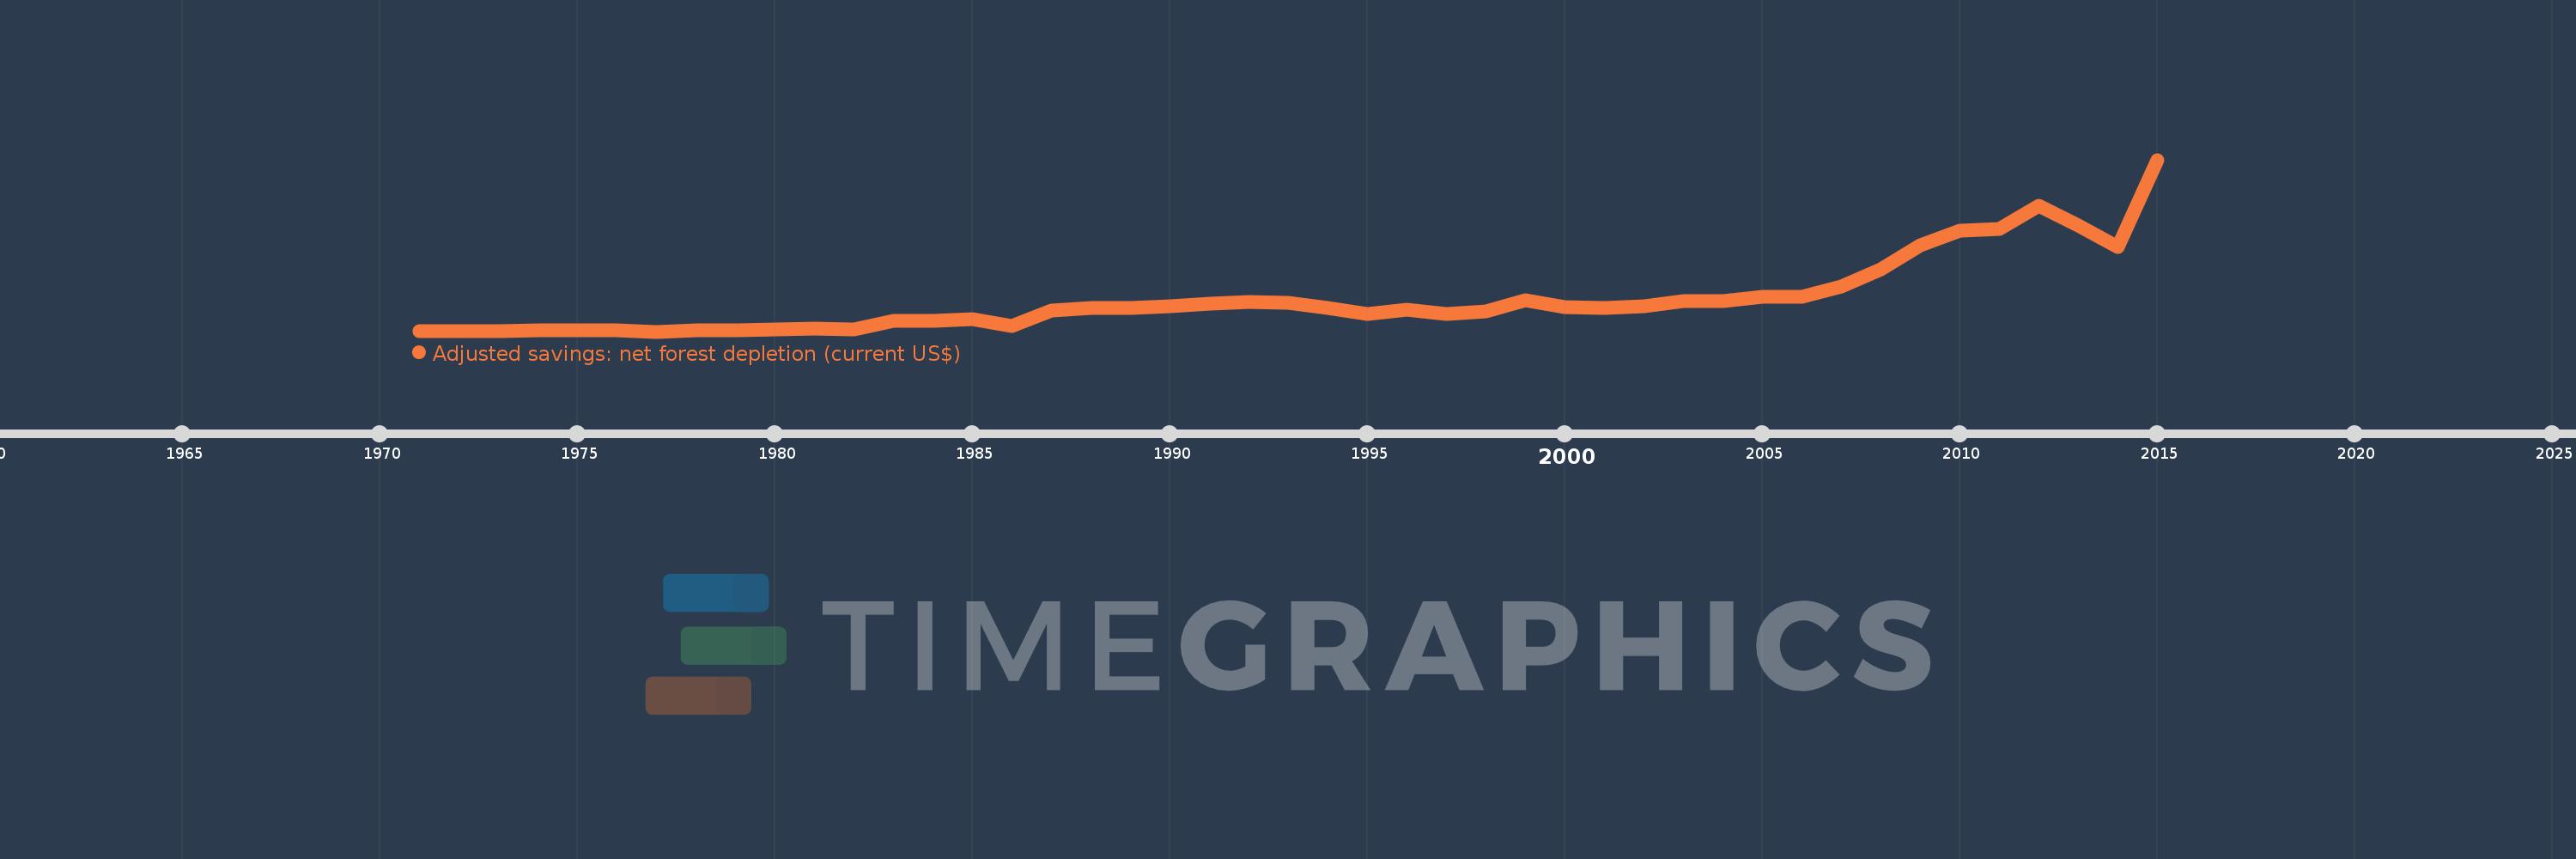
Adjusted savings: net forest depletion (current US$)
2015,2014,2013,2012,2011,2010,2009,2008,2007,2006,2005,2004,2003,2002,2001,2000,1999,1998,1997,1996,1995,1994,1993,1992,1991,1990,1989,1988,1987,1986,1985,1984,1983,1982,1981,1980,1979,1978,1977,1976,1975,1974,1973,1972,1971
This statistics in other country:
AfghanistanAlbaniaAlgeriaAngolaArgentinaArmeniaAustraliaAustriaAzerbaijanBahamas, TheBahrainBangladeshBarbadosBelarusBelgiumBelizeBeninBhutanBoliviaBotswanaBrazilBrunei DarussalamBulgariaBurkina FasoBurundiCabo VerdeCambodiaCameroonCanadaCentral African RepublicChadChileChinaColombiaComorosCongo, Dem. Rep.Congo, Rep.Costa RicaCote d'IvoireCroatiaCubaCyprusCzech RepublicDenmarkDjiboutiDominicaDominican RepublicEcuadorEgypt, Arab Rep.El SalvadorEquatorial GuineaEritreaEstoniaEthiopiaFijiFinlandFranceFrench PolynesiaGabonGambia, TheGeorgiaGermanyGhanaGreeceGuatemalaGuineaGuinea-BissauGuyanaHaitiHondurasHong Kong SAR, ChinaHungaryIcelandIndiaIndonesiaIran, Islamic Rep.IraqIrelandIsraelItalyJamaicaJapanJordanKazakhstanKenyaKiribatiKorea, Dem. People’s Rep.Korea, Rep.KuwaitKyrgyz RepublicLao PDRLatviaLebanonLesothoLiberiaLibyaLithuaniaLuxembourgMacao SAR, ChinaMacedonia, FYRMadagascarMalawiMalaysiaMaldivesMaliMauritaniaMauritiusMexicoMicronesia, Fed. Sts.MoldovaMongoliaMoroccoMozambiqueMyanmarNamibiaNepalNetherlandsNew CaledoniaNew ZealandNicaraguaNigerNigeriaNorwayOmanPakistanPanamaPapua New GuineaParaguayPeruPhilippinesPolandPortugalQatarRomaniaRussian FederationRwandaSamoaSao Tome and PrincipeSaudi ArabiaSenegalSeychellesSierra LeoneSingaporeSlovak RepublicSloveniaSolomon IslandsSomaliaSouth AfricaSpainSri LankaSt. LuciaSt. Vincent and the GrenadinesSudanSurinameSwazilandSwedenSwitzerlandSyrian Arab RepublicTajikistanTanzaniaThailandTogoTongaTrinidad and TobagoTunisiaTurkeyTurkmenistanUgandaUkraineUnited Arab EmiratesUnited KingdomUnited StatesUruguayUzbekistanVanuatuVenezuela, RBVietnamYemen, Rep.ZambiaZimbabwe Timeline:
This timeline shows a graph from 1971 to 2015 of Qatar. No data until 1970. Number of actual observations by date: 45.
Source name:
World Development Indicators
Source organization:
World Bank staff estimates based on sources and methods in World Bank's "The Changing Wealth of Nations: Measuring Sustainable Development in the New Millennium" (2011).
Categories, topics:
Economy & Growth, Environment
Last updated:
apr 23, 2017
Indicators value changes by year
Minimum:
588.307
jan 1, 1977
Maximum:
521.288K
jan 1, 2015
At the date of observation
Value
Absolute change
Change from previous value
jan 1, 1971
2.984K
+2.984K
0.0%
jan 1, 1972
1.827K
-1.156K
-38.76%
jan 1, 1973
2.28K
+452.304
24.75%
jan 1, 1974
5.442K
+3.163K
138.74%
jan 1, 1975
4.379K
-1.063K
-19.53%
jan 1, 1976
5.319K
+939.082
21.44%
jan 1, 1977
588.307
-4.73K
-88.94%
jan 1, 1978
4.228K
+3.639K
618.63%
jan 1, 1979
3.533K
-695.275
-16.45%
jan 1, 1980
8.248K
+4.715K
133.48%
jan 1, 1981
10.809K
+2.561K
31.05%
jan 1, 1982
8.396K
-2.412K
-22.32%
jan 1, 1983
32.223K
+23.826K
283.77%
jan 1, 1984
31.849K
-373.738
-1.16%
jan 1, 1985
39.613K
+7.764K
24.38%
jan 1, 1986
17.32K
-22.293K
-56.28%
jan 1, 1987
63.127K
+45.807K
264.47%
jan 1, 1988
72.128K
+9.0K
14.26%
jan 1, 1989
72.032K
-95.071
-0.13%
jan 1, 1990
78.624K
+6.592K
9.15%
jan 1, 1991
84.709K
+6.085K
7.74%
jan 1, 1992
90.825K
+6.116K
7.22%
jan 1, 1993
89.028K
-1.797K
-1.98%
jan 1, 1994
73.226K
-15.803K
-17.75%
jan 1, 1995
53.394K
-19.831K
-27.08%
jan 1, 1996
67.816K
+14.422K
27.01%
jan 1, 1997
54.517K
-13.299K
-19.61%
jan 1, 1998
61.856K
+7.338K
13.46%
jan 1, 1999
96.748K
+34.892K
56.41%
jan 1, 2000
73.923K
-22.825K
-23.59%
jan 1, 2001
73.363K
-560.273
-0.76%
jan 1, 2002
77.087K
+3.724K
5.08%
jan 1, 2003
93.149K
+16.062K
20.84%
jan 1, 2004
93.877K
+727.79
0.78%
jan 1, 2005
105.451K
+11.574K
12.33%
jan 1, 2006
106.034K
+583.226
0.55%
jan 1, 2007
136.773K
+30.739K
28.99%
jan 1, 2008
189.852K
+53.079K
38.81%
jan 1, 2009
262.106K
+72.255K
38.06%
jan 1, 2010
307.346K
+45.24K
17.26%
jan 1, 2011
311.471K
+4.125K
1.34%
jan 1, 2012
382.468K
+70.997K
22.79%
jan 1, 2013
321.876K
-60.592K
-15.84%
jan 1, 2014
256.214K
-65.663K
-20.4%
jan 1, 2015
521.288K
+265.075K
103.46%
Ranking of countries by current statistics by years


Comments: