29
/
en
AIzaSyAYiBZKx7MnpbEhh9jyipgxe19OcubqV5w
April 1, 2024
281878
Vietnam
VNM
true
2
1
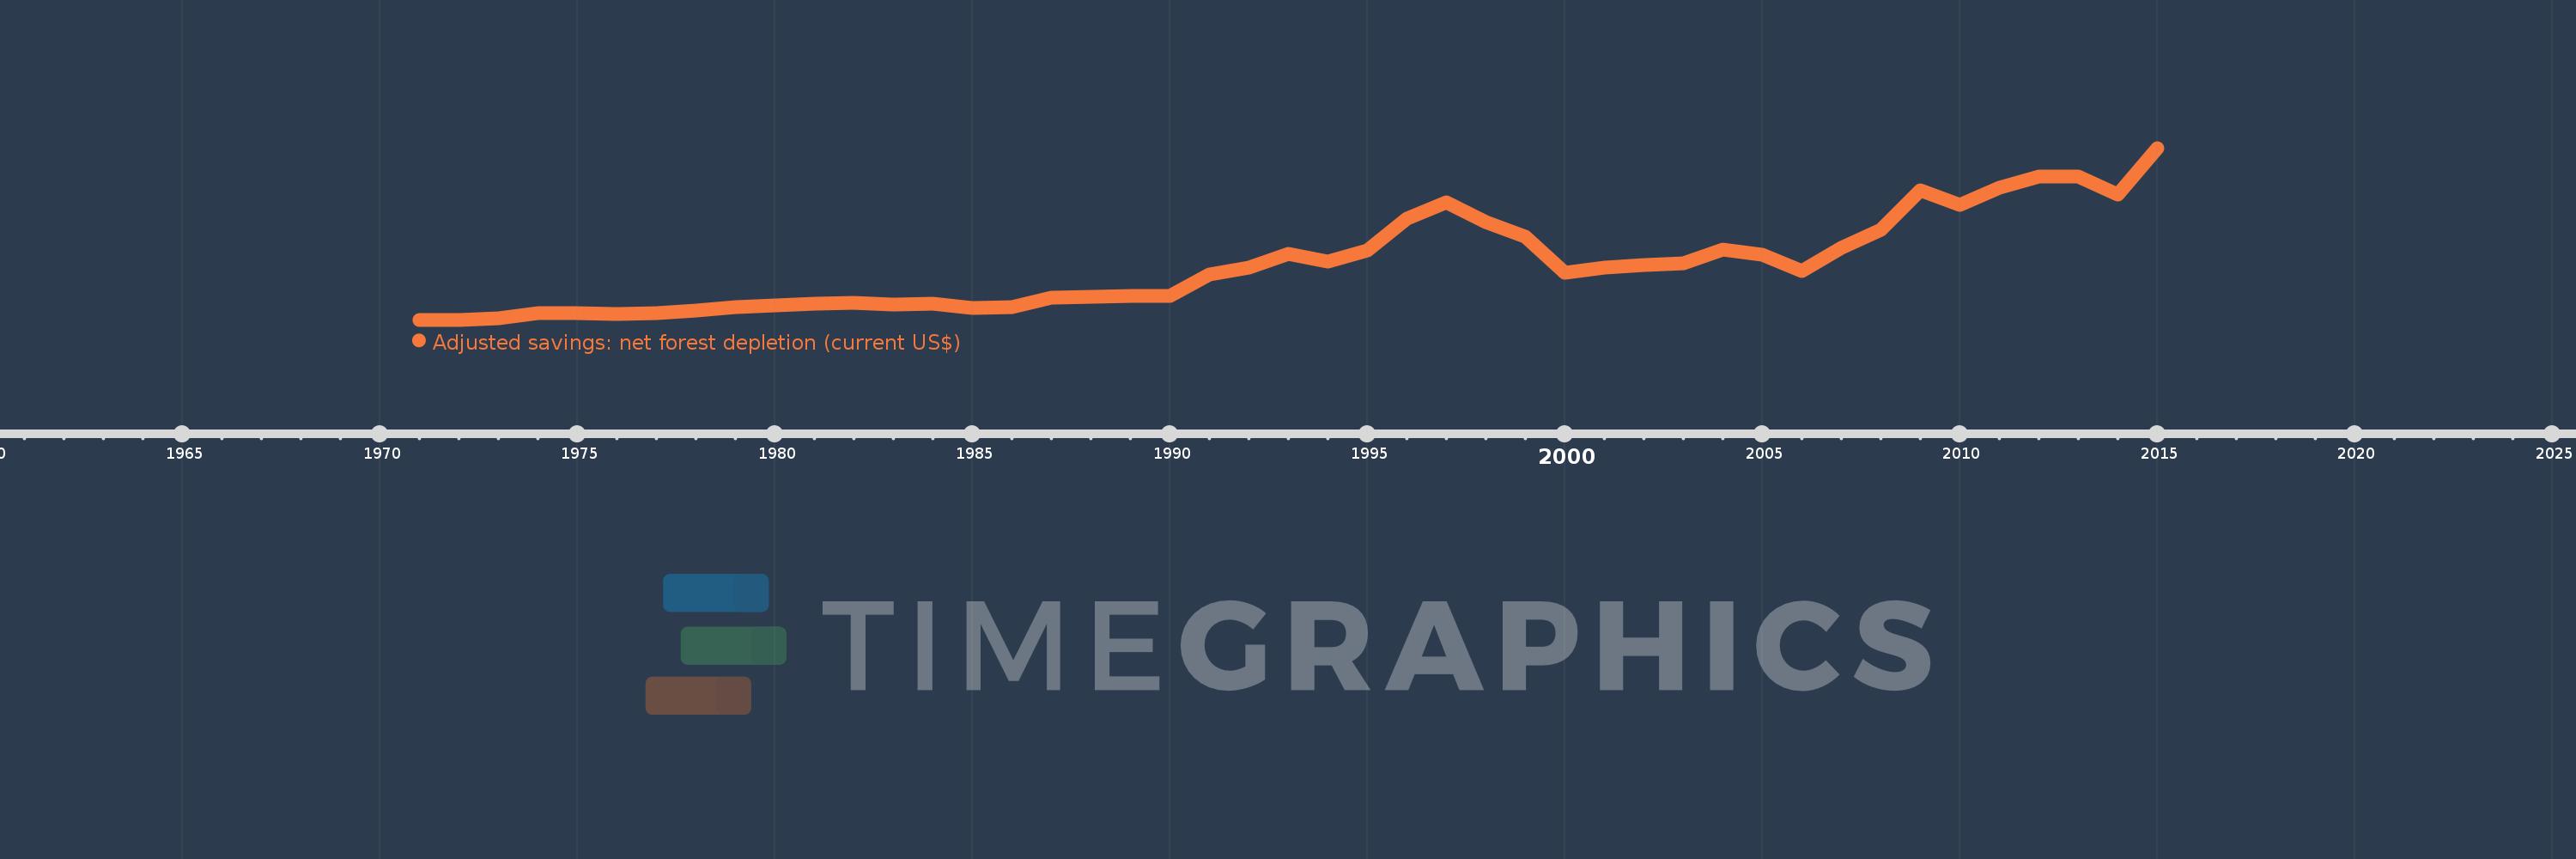
Adjusted savings: net forest depletion (current US$)
2015,2014,2013,2012,2011,2010,2009,2008,2007,2006,2005,2004,2003,2002,2001,2000,1999,1998,1997,1996,1995,1994,1993,1992,1991,1990,1989,1988,1987,1986,1985,1984,1983,1982,1981,1980,1979,1978,1977,1976,1975,1974,1973,1972,1971
This statistics in other country:
AfghanistanAlbaniaAlgeriaAngolaArgentinaArmeniaAustraliaAustriaAzerbaijanBahamas, TheBahrainBangladeshBarbadosBelarusBelgiumBelizeBeninBhutanBoliviaBotswanaBrazilBrunei DarussalamBulgariaBurkina FasoBurundiCabo VerdeCambodiaCameroonCanadaCentral African RepublicChadChileChinaColombiaComorosCongo, Dem. Rep.Congo, Rep.Costa RicaCote d'IvoireCroatiaCubaCyprusCzech RepublicDenmarkDjiboutiDominicaDominican RepublicEcuadorEgypt, Arab Rep.El SalvadorEquatorial GuineaEritreaEstoniaEthiopiaFijiFinlandFranceFrench PolynesiaGabonGambia, TheGeorgiaGermanyGhanaGreeceGuatemalaGuineaGuinea-BissauGuyanaHaitiHondurasHong Kong SAR, ChinaHungaryIcelandIndiaIndonesiaIran, Islamic Rep.IraqIrelandIsraelItalyJamaicaJapanJordanKazakhstanKenyaKiribatiKorea, Dem. People’s Rep.Korea, Rep.KuwaitKyrgyz RepublicLao PDRLatviaLebanonLesothoLiberiaLibyaLithuaniaLuxembourgMacao SAR, ChinaMacedonia, FYRMadagascarMalawiMalaysiaMaldivesMaliMauritaniaMauritiusMexicoMicronesia, Fed. Sts.MoldovaMongoliaMoroccoMozambiqueMyanmarNamibiaNepalNetherlandsNew CaledoniaNew ZealandNicaraguaNigerNigeriaNorwayOmanPakistanPanamaPapua New GuineaParaguayPeruPhilippinesPolandPortugalQatarRomaniaRussian FederationRwandaSamoaSao Tome and PrincipeSaudi ArabiaSenegalSeychellesSierra LeoneSingaporeSlovak RepublicSloveniaSolomon IslandsSomaliaSouth AfricaSpainSri LankaSt. LuciaSt. Vincent and the GrenadinesSudanSurinameSwazilandSwedenSwitzerlandSyrian Arab RepublicTajikistanTanzaniaThailandTogoTongaTrinidad and TobagoTunisiaTurkeyTurkmenistanUgandaUkraineUnited Arab EmiratesUnited KingdomUnited StatesUruguayUzbekistanVanuatuVenezuela, RBVietnamYemen, Rep.ZambiaZimbabwe Timeline:
This timeline shows a graph from 1971 to 2015 of Vietnam. No data until 1970. Number of actual observations by date: 45.
Source name:
World Development Indicators
Source organization:
World Bank staff estimates based on sources and methods in World Bank's "The Changing Wealth of Nations: Measuring Sustainable Development in the New Millennium" (2011).
Categories, topics:
Economy & Growth, Environment
Last updated:
apr 23, 2017
Indicators value changes by year
Minimum:
13.639 mln
jan 1, 1971
Maximum:
1.306 bln
jan 1, 2015
At the date of observation
Value
Absolute change
Change from previous value
jan 1, 1971
13.639 mln
+13.639 mln
0.0%
jan 1, 1972
14.242 mln
+603.145K
4.42%
jan 1, 1973
21.834 mln
+7.592 mln
53.31%
jan 1, 1974
62.214 mln
+40.381 mln
184.95%
jan 1, 1975
62.856 mln
+641.21K
1.03%
jan 1, 1976
56.83 mln
-6.026 mln
-9.59%
jan 1, 1977
61.177 mln
+4.347 mln
7.65%
jan 1, 1978
80.498 mln
+19.321 mln
31.58%
jan 1, 1979
109.852 mln
+29.353 mln
36.46%
jan 1, 1980
122.009 mln
+12.157 mln
11.07%
jan 1, 1981
135.446 mln
+13.437 mln
11.01%
jan 1, 1982
141.724 mln
+6.279 mln
4.64%
jan 1, 1983
126.237 mln
-15.487 mln
-10.93%
jan 1, 1984
131.352 mln
+5.115 mln
4.05%
jan 1, 1985
103.071 mln
-28.281 mln
-21.53%
jan 1, 1986
107.601 mln
+4.53 mln
4.4%
jan 1, 1987
179.288 mln
+71.687 mln
66.62%
jan 1, 1988
186.487 mln
+7.198 mln
4.01%
jan 1, 1989
190.397 mln
+3.911 mln
2.1%
jan 1, 1990
193.43 mln
+3.033 mln
1.59%
jan 1, 1991
351.706 mln
+158.276 mln
81.83%
jan 1, 1992
406.132 mln
+54.426 mln
15.47%
jan 1, 1993
509.423 mln
+103.291 mln
25.43%
jan 1, 1994
450.017 mln
-59.407 mln
-11.66%
jan 1, 1995
536.586 mln
+86.569 mln
19.24%
jan 1, 1996
773.512 mln
+236.927 mln
44.15%
jan 1, 1997
896.421 mln
+122.909 mln
15.89%
jan 1, 1998
750.588 mln
-145.833 mln
-16.27%
jan 1, 1999
637.862 mln
-112.726 mln
-15.02%
jan 1, 2000
366.455 mln
-271.407 mln
-42.55%
jan 1, 2001
403.273 mln
+36.818 mln
10.05%
jan 1, 2002
423.562 mln
+20.289 mln
5.03%
jan 1, 2003
438.108 mln
+14.546 mln
3.43%
jan 1, 2004
541.635 mln
+103.527 mln
23.63%
jan 1, 2005
500.28 mln
-41.355 mln
-7.64%
jan 1, 2006
381.464 mln
-118.816 mln
-23.75%
jan 1, 2007
554.03 mln
+172.566 mln
45.24%
jan 1, 2008
688.566 mln
+134.536 mln
24.28%
jan 1, 2009
990.007 mln
+301.441 mln
43.78%
jan 1, 2010
879.936 mln
-110.071 mln
-11.12%
jan 1, 2011
1.009 bln
+129.381 mln
14.7%
jan 1, 2012
1.089 bln
+79.766 mln
7.9%
jan 1, 2013
1.09 bln
+1.261 mln
0.12%
jan 1, 2014
956.402 mln
-133.942 mln
-12.28%
jan 1, 2015
1.306 bln
+349.978 mln
36.59%
Ranking of countries by current statistics by years


Comments: