30
/
AIzaSyAYiBZKx7MnpbEhh9jyipgxe19OcubqV5w
April 1, 2024
114501
Croatia
HRV
true
2
1
Adjusted savings: net forest depletion (current US$)
2015,2014,2013,2012,2011,2010,2009,2008,2007,2006,2005,2004,2003,2002,2001,2000,1999,1998,1997,1996,1995,1994,1993
Download
Global statistics library →Croatia →

Adjusted savings: net forest depletion (current US$)

This statistics in other country:

AfghanistanAlbaniaAlgeriaAngolaArgentinaArmeniaAustraliaAustriaAzerbaijanBahamas, TheBahrainBangladeshBarbadosBelarusBelgiumBelizeBeninBhutanBoliviaBotswanaBrazilBrunei DarussalamBulgariaBurkina FasoBurundiCabo VerdeCambodiaCameroonCanadaCentral African RepublicChadChileChinaColombiaComorosCongo, Dem. Rep.Congo, Rep.Costa RicaCote d'IvoireCroatiaCubaCyprusCzech RepublicDenmarkDjiboutiDominicaDominican RepublicEcuadorEgypt, Arab Rep.El SalvadorEquatorial GuineaEritreaEstoniaEthiopiaFijiFinlandFranceFrench PolynesiaGabonGambia, TheGeorgiaGermanyGhanaGreeceGuatemalaGuineaGuinea-BissauGuyanaHaitiHondurasHong Kong SAR, ChinaHungaryIcelandIndiaIndonesiaIran, Islamic Rep.IraqIrelandIsraelItalyJamaicaJapanJordanKazakhstanKenyaKiribatiKorea, Dem. People’s Rep.Korea, Rep.KuwaitKyrgyz RepublicLao PDRLatviaLebanonLesothoLiberiaLibyaLithuaniaLuxembourgMacao SAR, ChinaMacedonia, FYRMadagascarMalawiMalaysiaMaldivesMaliMauritaniaMauritiusMexicoMicronesia, Fed. Sts.MoldovaMongoliaMoroccoMozambiqueMyanmarNamibiaNepalNetherlandsNew CaledoniaNew ZealandNicaraguaNigerNigeriaNorwayOmanPakistanPanamaPapua New GuineaParaguayPeruPhilippinesPolandPortugalQatarRomaniaRussian FederationRwandaSamoaSao Tome and PrincipeSaudi ArabiaSenegalSeychellesSierra LeoneSingaporeSlovak RepublicSloveniaSolomon IslandsSomaliaSouth AfricaSpainSri LankaSt. LuciaSt. Vincent and the GrenadinesSudanSurinameSwazilandSwedenSwitzerlandSyrian Arab RepublicTajikistanTanzaniaThailandTogoTongaTrinidad and TobagoTunisiaTurkeyTurkmenistanUgandaUkraineUnited Arab EmiratesUnited KingdomUnited StatesUruguayUzbekistanVanuatuVenezuela, RBVietnamYemen, Rep.ZambiaZimbabwe

Timeline:

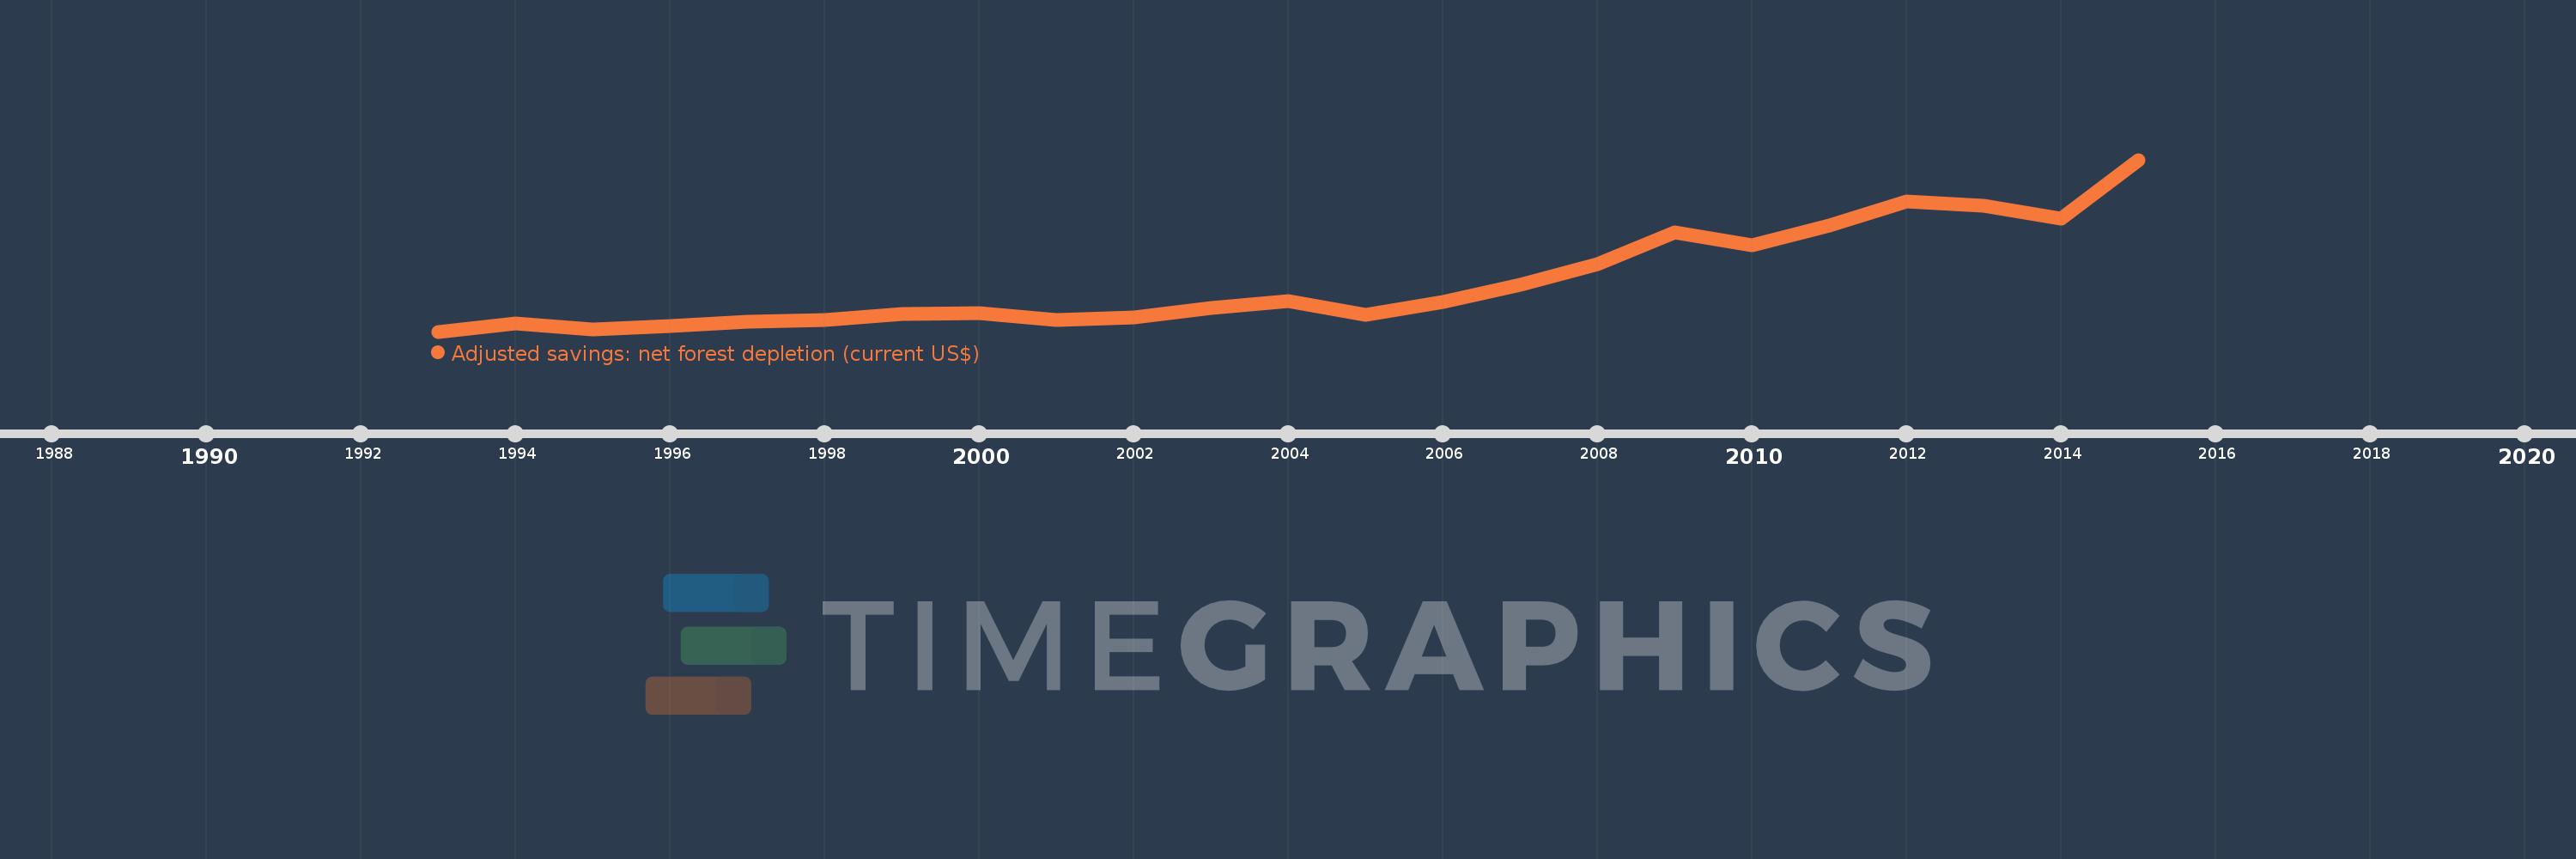
This timeline shows a graph from 1993 to 2015 of Croatia. No data until 1992. Number of actual observations by date: 23.

Source name:

World Development Indicators

Source organization:

World Bank staff estimates based on sources and methods in World Bank's "The Changing Wealth of Nations: Measuring Sustainable Development in the New Millennium" (2011).

Categories, topics:

Economy & Growth, Environment

Last updated:

apr 23, 2017

Indicators value changes by year

Meaning:
228.091 mln
Minimum:
80.134 mln
jan 1, 1993
Maximum:
589.545 mln
jan 1, 2015
At the date of observation
Value
Absolute change
Change from the previous value
jan 1, 1993
80.134 mln
+80.134 mln
0.0%
jan 1, 1994
104.246 mln
+24.112 mln
30.09%
jan 1, 1995
87.435 mln
-16.812 mln
-16.13%
jan 1, 1996
97.565 mln
+10.131 mln
11.59%
jan 1, 1997
110.049 mln
+12.483 mln
12.79%
jan 1, 1998
113.606 mln
+3.557 mln
3.23%
jan 1, 1999
132.225 mln
+18.619 mln
16.39%
jan 1, 2000
135.127 mln
+2.902 mln
2.19%
jan 1, 2001
114.766 mln
-20.361 mln
-15.07%
jan 1, 2002
121.234 mln
+6.468 mln
5.64%
jan 1, 2003
149.827 mln
+28.594 mln
23.59%
jan 1, 2004
171.357 mln
+21.53 mln
14.37%
jan 1, 2005
131.044 mln
-40.313 mln
-23.53%
jan 1, 2006
167.575 mln
+36.531 mln
27.88%
jan 1, 2007
219.535 mln
+51.96 mln
31.01%
jan 1, 2008
280.481 mln
+60.946 mln
27.76%
jan 1, 2009
374.874 mln
+94.393 mln
33.65%
jan 1, 2010
335.244 mln
-39.629 mln
-10.57%
jan 1, 2011
395.833 mln
+60.589 mln
18.07%
jan 1, 2012
467.128 mln
+71.295 mln
18.01%
jan 1, 2013
453.368 mln
-13.76 mln
-2.95%
jan 1, 2014
413.894 mln
-39.474 mln
-8.71%
jan 1, 2015
589.545 mln
+175.652 mln
42.44%

Ranking of countries by current statistics by years