29
/
en
AIzaSyAYiBZKx7MnpbEhh9jyipgxe19OcubqV5w
April 1, 2024
207580
Nepal
NPL
true
2
1
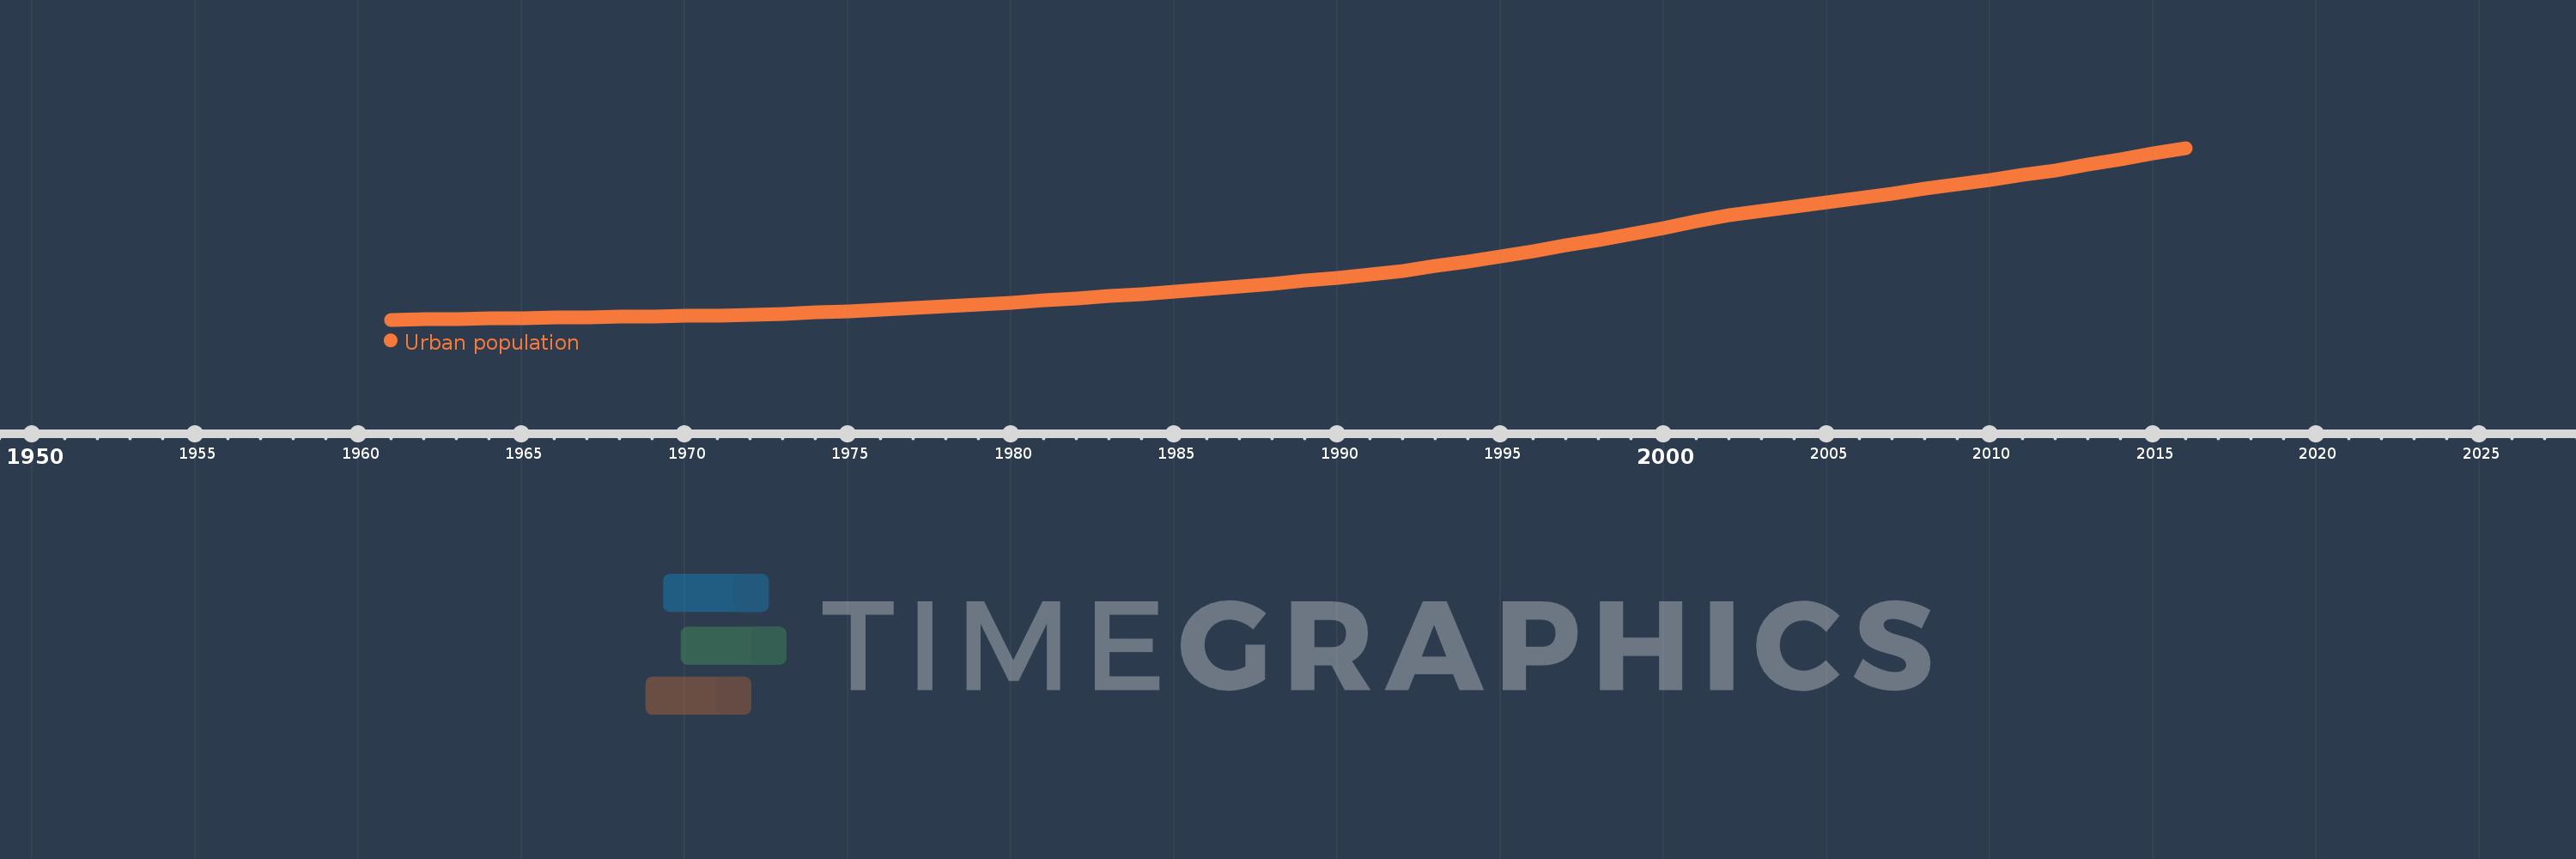
Urban population
2016,2015,2014,2013,2012,2011,2010,2009,2008,2007,2006,2005,2004,2003,2002,2001,2000,1999,1998,1997,1996,1995,1994,1993,1992,1991,1990,1989,1988,1987,1986,1985,1984,1983,1982,1981,1980,1979,1978,1977,1976,1975,1974,1973,1972,1971,1970,1969,1968,1967,1966,1965,1964,1963,1962,1961
This statistics in other country:
AfghanistanAlbaniaAlgeriaAmerican SamoaAndorraAngolaAntigua and BarbudaArab WorldArgentinaArmeniaArubaAustraliaAustriaAzerbaijanBahamas, TheBahrainBangladeshBarbadosBelarusBelgiumBelizeBeninBermudaBhutanBoliviaBosnia and HerzegovinaBotswanaBrazilBritish Virgin IslandsBrunei DarussalamBulgariaBurkina FasoBurundiCabo VerdeCambodiaCameroonCanadaCaribbean small statesCayman IslandsCentral African RepublicCentral Europe and the BalticsChadChannel IslandsChileChinaColombiaComorosCongo, Dem. Rep.Congo, Rep.Costa RicaCote d'IvoireCroatiaCubaCuracaoCyprusCzech RepublicDenmarkDjiboutiDominicaDominican RepublicEarly-demographic dividendEast Asia & PacificEast Asia & Pacific (excluding high income)East Asia & Pacific (IDA & IBRD countries)EcuadorEgypt, Arab Rep.El SalvadorEquatorial GuineaEritreaEstoniaEthiopiaEuro areaEurope & Central AsiaEurope & Central Asia (excluding high income)Europe & Central Asia (IDA & IBRD countries)European UnionFaroe IslandsFijiFinlandFragile and conflict affected situationsFranceFrench PolynesiaGabonGambia, TheGeorgiaGermanyGhanaGibraltarGreeceGreenlandGrenadaGuamGuatemalaGuineaGuinea-BissauGuyanaHaitiHeavily indebted poor countries (HIPC)High incomeHondurasHong Kong SAR, ChinaHungaryIBRD onlyIcelandIDA & IBRD totalIDA blendIDA onlyIDA totalIndiaIndonesiaIran, Islamic Rep.IraqIrelandIsle of ManIsraelItalyJamaicaJapanJordanKazakhstanKenyaKiribatiKorea, Dem. People’s Rep.Korea, Rep.KuwaitKyrgyz RepublicLao PDRLate-demographic dividendLatin America & Caribbean Latin America & Caribbean (excluding high income)Latin America & the Caribbean (IDA & IBRD countries)LatviaLeast developed countries: UN classificationLebanonLesothoLiberiaLibyaLiechtensteinLithuaniaLow & middle incomeLow incomeLower middle incomeLuxembourgMacao SAR, ChinaMacedonia, FYRMadagascarMalawiMalaysiaMaldivesMaliMaltaMarshall IslandsMauritaniaMauritiusMexicoMicronesia, Fed. Sts.Middle East & North AfricaMiddle East & North Africa (excluding high income)Middle East & North Africa (IDA & IBRD countries)Middle incomeMoldovaMonacoMongoliaMontenegroMoroccoMozambiqueMyanmarNamibiaNauruNepalNetherlandsNew CaledoniaNew ZealandNicaraguaNigerNigeriaNorth AmericaNorthern Mariana IslandsNorwayOECD membersOmanOther small statesPacific island small statesPakistanPalauPanamaPapua New GuineaParaguayPeruPhilippinesPolandPortugalPost-demographic dividendPre-demographic dividendPuerto RicoQatarRomaniaRussian FederationRwandaSamoaSan MarinoSao Tome and PrincipeSaudi ArabiaSenegalSerbiaSeychellesSierra LeoneSingaporeSint Maarten (Dutch part)Slovak RepublicSloveniaSmall statesSolomon IslandsSomaliaSouth AfricaSouth AsiaSouth Asia (IDA & IBRD)South SudanSpainSri LankaSt. Kitts and NevisSt. LuciaSt. Vincent and the GrenadinesSub-Saharan Africa Sub-Saharan Africa (excluding high income)Sub-Saharan Africa (IDA & IBRD countries)SudanSurinameSwazilandSwedenSwitzerlandSyrian Arab RepublicTajikistanTanzaniaThailandTimor-LesteTogoTongaTrinidad and TobagoTunisiaTurkeyTurkmenistanTurks and Caicos IslandsTuvaluUgandaUkraineUnited Arab EmiratesUnited KingdomUnited StatesUpper middle incomeUruguayUzbekistanVanuatuVenezuela, RBVietnamVirgin Islands (U.S.)West Bank and GazaWorldYemen, Rep.ZambiaZimbabwe Timeline:
This timeline shows a graph from 1961 to 2016 of Nepal. No data until 1960. Number of actual observations by date: 56.
Source name:
World Development Indicators
Source organization:
World Bank Staff estimates based on United Nations, World Urbanization Prospects.
Categories, topics:
Climate Change, Urban Development
Last updated:
apr 23, 2017
Indicators value changes by year
Minimum:
349.982K
jan 1, 1961
Maximum:
5.308 mln
jan 1, 2016
At the date of observation
Value
Absolute change
Change from previous value
jan 1, 1961
349.982K
+349.982K
0.0%
jan 1, 1962
364.783K
+14.801K
4.23%
jan 1, 1963
374.819K
+10.036K
2.75%
jan 1, 1964
385.194K
+10.375K
2.77%
jan 1, 1965
396.104K
+10.91K
2.83%
jan 1, 1966
407.52K
+11.416K
2.88%
jan 1, 1967
419.605K
+12.085K
2.97%
jan 1, 1968
432.272K
+12.667K
3.02%
jan 1, 1969
445.638K
+13.366K
3.09%
jan 1, 1970
459.578K
+13.94K
3.13%
jan 1, 1971
474.205K
+14.627K
3.18%
jan 1, 1972
489.91K
+15.705K
3.31%
jan 1, 1973
524.237K
+34.327K
7.01%
jan 1, 1974
561.006K
+36.769K
7.01%
jan 1, 1975
600.602K
+39.596K
7.06%
jan 1, 1976
643.041K
+42.439K
7.07%
jan 1, 1977
688.735K
+45.694K
7.11%
jan 1, 1978
737.708K
+48.973K
7.11%
jan 1, 1979
790.133K
+52.425K
7.11%
jan 1, 1980
846.481K
+56.348K
7.13%
jan 1, 1981
906.955K
+60.474K
7.14%
jan 1, 1982
971.53K
+64.575K
7.12%
jan 1, 1983
1.032 mln
+60.302K
6.21%
jan 1, 1984
1.096 mln
+63.92K
6.19%
jan 1, 1985
1.163 mln
+67.614K
6.17%
jan 1, 1986
1.235 mln
+71.155K
6.12%
jan 1, 1987
1.309 mln
+74.723K
6.05%
jan 1, 1988
1.388 mln
+78.743K
6.01%
jan 1, 1989
1.472 mln
+83.751K
6.03%
jan 1, 1990
1.562 mln
+90.021K
6.12%
jan 1, 1991
1.659 mln
+97.63K
6.25%
jan 1, 1992
1.766 mln
+106.597K
6.42%
jan 1, 1993
1.895 mln
+128.544K
7.28%
jan 1, 1994
2.032 mln
+137.754K
7.27%
jan 1, 1995
2.178 mln
+145.857K
7.18%
jan 1, 1996
2.331 mln
+152.398K
7.0%
jan 1, 1997
2.49 mln
+159.122K
6.83%
jan 1, 1998
2.655 mln
+165.296K
6.64%
jan 1, 1999
2.827 mln
+171.571K
6.46%
jan 1, 2000
3.004 mln
+177.85K
6.29%
jan 1, 2001
3.189 mln
+184.161K
6.13%
jan 1, 2002
3.372 mln
+183.226K
5.75%
jan 1, 2003
3.497 mln
+125.09K
3.71%
jan 1, 2004
3.622 mln
+125.052K
3.58%
jan 1, 2005
3.747 mln
+125.307K
3.46%
jan 1, 2006
3.873 mln
+125.491K
3.35%
jan 1, 2007
3.998 mln
+125.418K
3.24%
jan 1, 2008
4.124 mln
+125.663K
3.14%
jan 1, 2009
4.252 mln
+127.731K
3.1%
jan 1, 2010
4.383 mln
+131.752K
3.1%
jan 1, 2011
4.521 mln
+137.797K
3.14%
jan 1, 2012
4.666 mln
+144.522K
3.2%
jan 1, 2013
4.818 mln
+151.952K
3.26%
jan 1, 2014
4.976 mln
+158.52K
3.29%
jan 1, 2015
5.14 mln
+163.855K
3.29%
jan 1, 2016
5.308 mln
+167.91K
3.27%
Ranking of countries by current statistics by years


Comments: