29
/
en
AIzaSyAYiBZKx7MnpbEhh9jyipgxe19OcubqV5w
April 1, 2024
31239
Europe & Central Asia
ECS
false
2
1
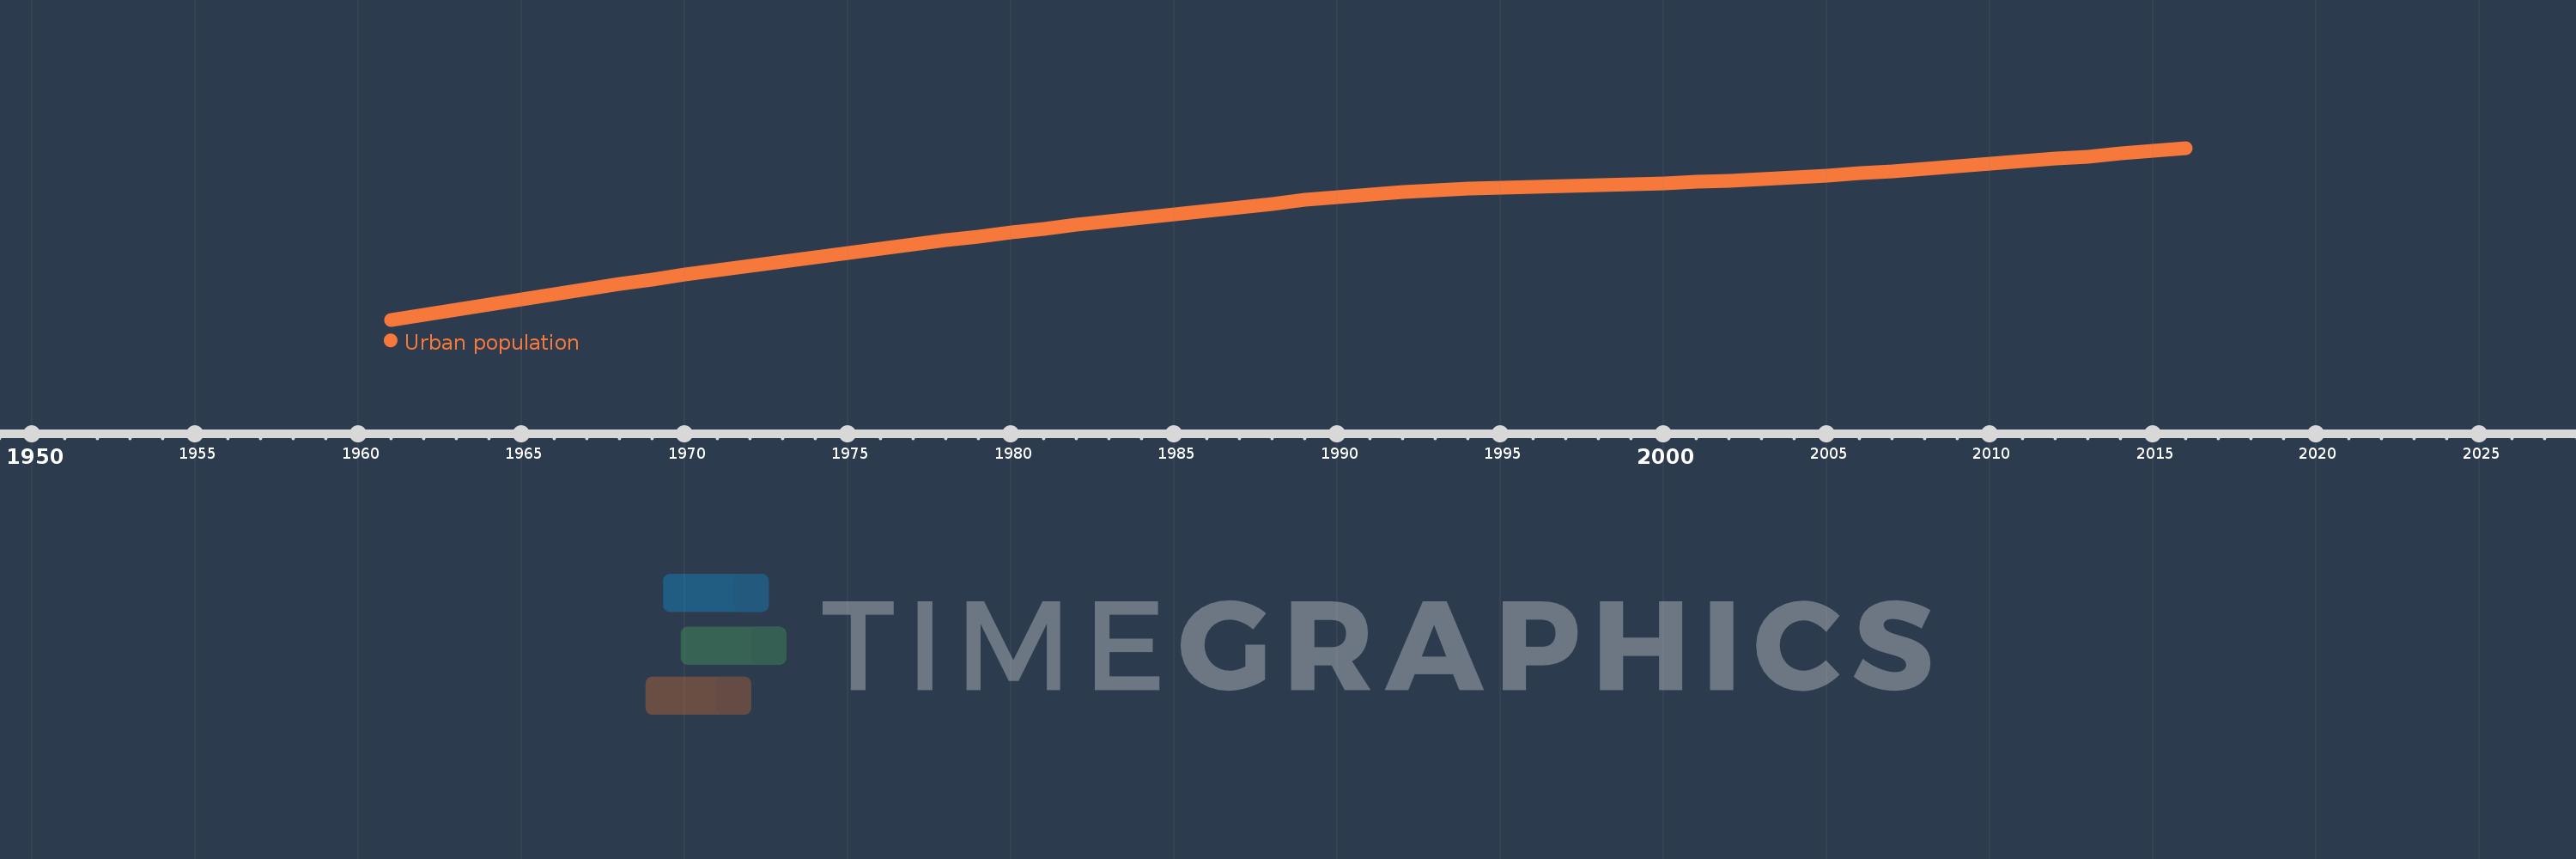
Urban population
2016,2015,2014,2013,2012,2011,2010,2009,2008,2007,2006,2005,2004,2003,2002,2001,2000,1999,1998,1997,1996,1995,1994,1993,1992,1991,1990,1989,1988,1987,1986,1985,1984,1983,1982,1981,1980,1979,1978,1977,1976,1975,1974,1973,1972,1971,1970,1969,1968,1967,1966,1965,1964,1963,1962,1961
This statistics in other country:
AfghanistanAlbaniaAlgeriaAmerican SamoaAndorraAngolaAntigua and BarbudaArab WorldArgentinaArmeniaArubaAustraliaAustriaAzerbaijanBahamas, TheBahrainBangladeshBarbadosBelarusBelgiumBelizeBeninBermudaBhutanBoliviaBosnia and HerzegovinaBotswanaBrazilBritish Virgin IslandsBrunei DarussalamBulgariaBurkina FasoBurundiCabo VerdeCambodiaCameroonCanadaCaribbean small statesCayman IslandsCentral African RepublicCentral Europe and the BalticsChadChannel IslandsChileChinaColombiaComorosCongo, Dem. Rep.Congo, Rep.Costa RicaCote d'IvoireCroatiaCubaCuracaoCyprusCzech RepublicDenmarkDjiboutiDominicaDominican RepublicEarly-demographic dividendEast Asia & PacificEast Asia & Pacific (excluding high income)East Asia & Pacific (IDA & IBRD countries)EcuadorEgypt, Arab Rep.El SalvadorEquatorial GuineaEritreaEstoniaEthiopiaEuro areaEurope & Central AsiaEurope & Central Asia (excluding high income)Europe & Central Asia (IDA & IBRD countries)European UnionFaroe IslandsFijiFinlandFragile and conflict affected situationsFranceFrench PolynesiaGabonGambia, TheGeorgiaGermanyGhanaGibraltarGreeceGreenlandGrenadaGuamGuatemalaGuineaGuinea-BissauGuyanaHaitiHeavily indebted poor countries (HIPC)High incomeHondurasHong Kong SAR, ChinaHungaryIBRD onlyIcelandIDA & IBRD totalIDA blendIDA onlyIDA totalIndiaIndonesiaIran, Islamic Rep.IraqIrelandIsle of ManIsraelItalyJamaicaJapanJordanKazakhstanKenyaKiribatiKorea, Dem. People’s Rep.Korea, Rep.KuwaitKyrgyz RepublicLao PDRLate-demographic dividendLatin America & Caribbean Latin America & Caribbean (excluding high income)Latin America & the Caribbean (IDA & IBRD countries)LatviaLeast developed countries: UN classificationLebanonLesothoLiberiaLibyaLiechtensteinLithuaniaLow & middle incomeLow incomeLower middle incomeLuxembourgMacao SAR, ChinaMacedonia, FYRMadagascarMalawiMalaysiaMaldivesMaliMaltaMarshall IslandsMauritaniaMauritiusMexicoMicronesia, Fed. Sts.Middle East & North AfricaMiddle East & North Africa (excluding high income)Middle East & North Africa (IDA & IBRD countries)Middle incomeMoldovaMonacoMongoliaMontenegroMoroccoMozambiqueMyanmarNamibiaNauruNepalNetherlandsNew CaledoniaNew ZealandNicaraguaNigerNigeriaNorth AmericaNorthern Mariana IslandsNorwayOECD membersOmanOther small statesPacific island small statesPakistanPalauPanamaPapua New GuineaParaguayPeruPhilippinesPolandPortugalPost-demographic dividendPre-demographic dividendPuerto RicoQatarRomaniaRussian FederationRwandaSamoaSan MarinoSao Tome and PrincipeSaudi ArabiaSenegalSerbiaSeychellesSierra LeoneSingaporeSint Maarten (Dutch part)Slovak RepublicSloveniaSmall statesSolomon IslandsSomaliaSouth AfricaSouth AsiaSouth Asia (IDA & IBRD)South SudanSpainSri LankaSt. Kitts and NevisSt. LuciaSt. Vincent and the GrenadinesSub-Saharan Africa Sub-Saharan Africa (excluding high income)Sub-Saharan Africa (IDA & IBRD countries)SudanSurinameSwazilandSwedenSwitzerlandSyrian Arab RepublicTajikistanTanzaniaThailandTimor-LesteTogoTongaTrinidad and TobagoTunisiaTurkeyTurkmenistanTurks and Caicos IslandsTuvaluUgandaUkraineUnited Arab EmiratesUnited KingdomUnited StatesUpper middle incomeUruguayUzbekistanVanuatuVenezuela, RBVietnamVirgin Islands (U.S.)West Bank and GazaWorldYemen, Rep.ZambiaZimbabwe Timeline:
This timeline shows a graph from 1961 to 2016 of Europe & Central Asia. No data until 1960. Number of actual observations by date: 56.
Source name:
World Development Indicators
Source organization:
World Bank Staff estimates based on United Nations, World Urbanization Prospects.
Categories, topics:
Climate Change, Urban Development
Last updated:
apr 23, 2017
Indicators value changes by year
Minimum:
369.147 mln
jan 1, 1961
Maximum:
642.193 mln
jan 1, 2016
At the date of observation
Value
Absolute change
Change from previous value
jan 1, 1961
369.147 mln
+369.147 mln
0.0%
jan 1, 1962
377.012 mln
+7.865 mln
2.13%
jan 1, 1963
385.081 mln
+8.07 mln
2.14%
jan 1, 1964
393.447 mln
+8.366 mln
2.17%
jan 1, 1965
401.845 mln
+8.398 mln
2.13%
jan 1, 1966
410.245 mln
+8.4 mln
2.09%
jan 1, 1967
418.127 mln
+7.883 mln
1.92%
jan 1, 1968
425.84 mln
+7.713 mln
1.84%
jan 1, 1969
433.332 mln
+7.492 mln
1.76%
jan 1, 1970
440.611 mln
+7.279 mln
1.68%
jan 1, 1971
447.503 mln
+6.892 mln
1.56%
jan 1, 1972
454.418 mln
+6.915 mln
1.55%
jan 1, 1973
461.733 mln
+7.315 mln
1.61%
jan 1, 1974
468.847 mln
+7.114 mln
1.54%
jan 1, 1975
475.818 mln
+6.971 mln
1.49%
jan 1, 1976
482.478 mln
+6.66 mln
1.4%
jan 1, 1977
488.923 mln
+6.445 mln
1.34%
jan 1, 1978
495.285 mln
+6.362 mln
1.3%
jan 1, 1979
501.735 mln
+6.45 mln
1.3%
jan 1, 1980
507.838 mln
+6.103 mln
1.22%
jan 1, 1981
513.694 mln
+5.856 mln
1.15%
jan 1, 1982
519.858 mln
+6.164 mln
1.2%
jan 1, 1983
525.493 mln
+5.635 mln
1.08%
jan 1, 1984
530.915 mln
+5.421 mln
1.03%
jan 1, 1985
536.423 mln
+5.508 mln
1.04%
jan 1, 1986
541.947 mln
+5.524 mln
1.03%
jan 1, 1987
547.549 mln
+5.602 mln
1.03%
jan 1, 1988
552.89 mln
+5.341 mln
0.98%
jan 1, 1989
559.264 mln
+6.373 mln
1.15%
jan 1, 1990
564.431 mln
+5.167 mln
0.92%
jan 1, 1991
568.564 mln
+4.133 mln
0.73%
jan 1, 1992
571.783 mln
+3.219 mln
0.57%
jan 1, 1993
574.78 mln
+2.997 mln
0.52%
jan 1, 1994
577.325 mln
+2.545 mln
0.44%
jan 1, 1995
579.104 mln
+1.779 mln
0.31%
jan 1, 1996
580.678 mln
+1.574 mln
0.27%
jan 1, 1997
582.0 mln
+1.321 mln
0.23%
jan 1, 1998
583.408 mln
+1.409 mln
0.24%
jan 1, 1999
584.753 mln
+1.344 mln
0.23%
jan 1, 2000
586.31 mln
+1.557 mln
0.27%
jan 1, 2001
587.878 mln
+1.569 mln
0.27%
jan 1, 2002
589.901 mln
+2.023 mln
0.34%
jan 1, 2003
592.471 mln
+2.57 mln
0.44%
jan 1, 2004
595.506 mln
+3.035 mln
0.51%
jan 1, 2005
598.772 mln
+3.266 mln
0.55%
jan 1, 2006
602.115 mln
+3.343 mln
0.56%
jan 1, 2007
605.542 mln
+3.427 mln
0.57%
jan 1, 2008
609.263 mln
+3.721 mln
0.61%
jan 1, 2009
613.286 mln
+4.023 mln
0.66%
jan 1, 2010
617.313 mln
+4.027 mln
0.66%
jan 1, 2011
621.175 mln
+3.862 mln
0.63%
jan 1, 2012
625.247 mln
+4.072 mln
0.66%
jan 1, 2013
628.29 mln
+3.042 mln
0.49%
jan 1, 2014
633.984 mln
+5.694 mln
0.91%
jan 1, 2015
637.736 mln
+3.752 mln
0.59%
jan 1, 2016
642.193 mln
+4.458 mln
0.7%
Ranking of countries by current statistics by years


Comments: