29
/
en
AIzaSyAYiBZKx7MnpbEhh9jyipgxe19OcubqV5w
April 1, 2024
187354
Malawi
MWI
true
2
1
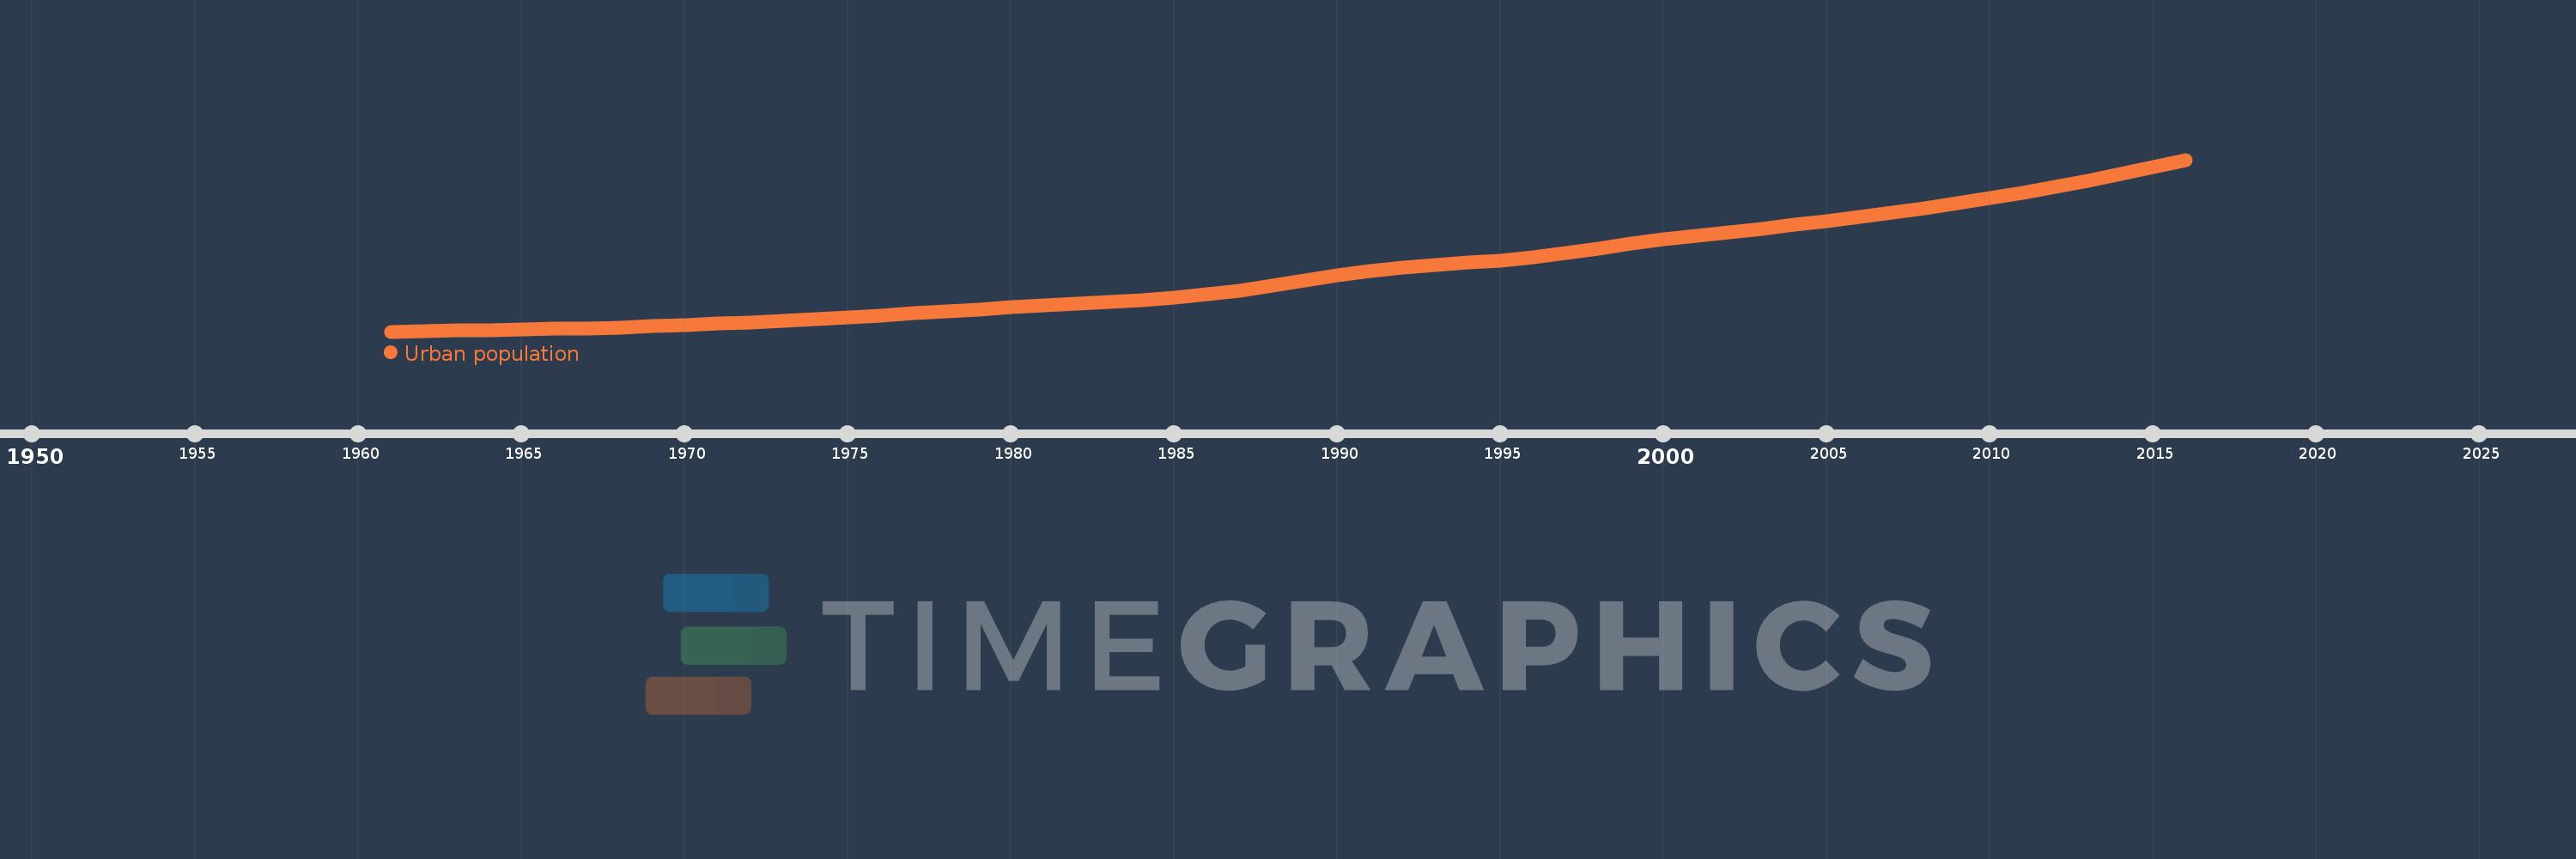
Urban population
2016,2015,2014,2013,2012,2011,2010,2009,2008,2007,2006,2005,2004,2003,2002,2001,2000,1999,1998,1997,1996,1995,1994,1993,1992,1991,1990,1989,1988,1987,1986,1985,1984,1983,1982,1981,1980,1979,1978,1977,1976,1975,1974,1973,1972,1971,1970,1969,1968,1967,1966,1965,1964,1963,1962,1961
This statistics in other country:
AfghanistanAlbaniaAlgeriaAmerican SamoaAndorraAngolaAntigua and BarbudaArab WorldArgentinaArmeniaArubaAustraliaAustriaAzerbaijanBahamas, TheBahrainBangladeshBarbadosBelarusBelgiumBelizeBeninBermudaBhutanBoliviaBosnia and HerzegovinaBotswanaBrazilBritish Virgin IslandsBrunei DarussalamBulgariaBurkina FasoBurundiCabo VerdeCambodiaCameroonCanadaCaribbean small statesCayman IslandsCentral African RepublicCentral Europe and the BalticsChadChannel IslandsChileChinaColombiaComorosCongo, Dem. Rep.Congo, Rep.Costa RicaCote d'IvoireCroatiaCubaCuracaoCyprusCzech RepublicDenmarkDjiboutiDominicaDominican RepublicEarly-demographic dividendEast Asia & PacificEast Asia & Pacific (excluding high income)East Asia & Pacific (IDA & IBRD countries)EcuadorEgypt, Arab Rep.El SalvadorEquatorial GuineaEritreaEstoniaEthiopiaEuro areaEurope & Central AsiaEurope & Central Asia (excluding high income)Europe & Central Asia (IDA & IBRD countries)European UnionFaroe IslandsFijiFinlandFragile and conflict affected situationsFranceFrench PolynesiaGabonGambia, TheGeorgiaGermanyGhanaGibraltarGreeceGreenlandGrenadaGuamGuatemalaGuineaGuinea-BissauGuyanaHaitiHeavily indebted poor countries (HIPC)High incomeHondurasHong Kong SAR, ChinaHungaryIBRD onlyIcelandIDA & IBRD totalIDA blendIDA onlyIDA totalIndiaIndonesiaIran, Islamic Rep.IraqIrelandIsle of ManIsraelItalyJamaicaJapanJordanKazakhstanKenyaKiribatiKorea, Dem. People’s Rep.Korea, Rep.KuwaitKyrgyz RepublicLao PDRLate-demographic dividendLatin America & Caribbean Latin America & Caribbean (excluding high income)Latin America & the Caribbean (IDA & IBRD countries)LatviaLeast developed countries: UN classificationLebanonLesothoLiberiaLibyaLiechtensteinLithuaniaLow & middle incomeLow incomeLower middle incomeLuxembourgMacao SAR, ChinaMacedonia, FYRMadagascarMalawiMalaysiaMaldivesMaliMaltaMarshall IslandsMauritaniaMauritiusMexicoMicronesia, Fed. Sts.Middle East & North AfricaMiddle East & North Africa (excluding high income)Middle East & North Africa (IDA & IBRD countries)Middle incomeMoldovaMonacoMongoliaMontenegroMoroccoMozambiqueMyanmarNamibiaNauruNepalNetherlandsNew CaledoniaNew ZealandNicaraguaNigerNigeriaNorth AmericaNorthern Mariana IslandsNorwayOECD membersOmanOther small statesPacific island small statesPakistanPalauPanamaPapua New GuineaParaguayPeruPhilippinesPolandPortugalPost-demographic dividendPre-demographic dividendPuerto RicoQatarRomaniaRussian FederationRwandaSamoaSan MarinoSao Tome and PrincipeSaudi ArabiaSenegalSerbiaSeychellesSierra LeoneSingaporeSint Maarten (Dutch part)Slovak RepublicSloveniaSmall statesSolomon IslandsSomaliaSouth AfricaSouth AsiaSouth Asia (IDA & IBRD)South SudanSpainSri LankaSt. Kitts and NevisSt. LuciaSt. Vincent and the GrenadinesSub-Saharan Africa Sub-Saharan Africa (excluding high income)Sub-Saharan Africa (IDA & IBRD countries)SudanSurinameSwazilandSwedenSwitzerlandSyrian Arab RepublicTajikistanTanzaniaThailandTimor-LesteTogoTongaTrinidad and TobagoTunisiaTurkeyTurkmenistanTurks and Caicos IslandsTuvaluUgandaUkraineUnited Arab EmiratesUnited KingdomUnited StatesUpper middle incomeUruguayUzbekistanVanuatuVenezuela, RBVietnamVirgin Islands (U.S.)West Bank and GazaWorldYemen, Rep.ZambiaZimbabwe Timeline:
This timeline shows a graph from 1961 to 2016 of Malawi. No data until 1960. Number of actual observations by date: 56.
Source name:
World Development Indicators
Source organization:
World Bank Staff estimates based on United Nations, World Urbanization Prospects.
Categories, topics:
Climate Change, Urban Development
Last updated:
apr 23, 2017
Indicators value changes by year
Minimum:
158.857K
jan 1, 1961
Maximum:
2.801 mln
jan 1, 2016
At the date of observation
Value
Absolute change
Change from previous value
jan 1, 1961
158.857K
+158.857K
0.0%
jan 1, 1962
166.094K
+7.237K
4.56%
jan 1, 1963
173.706K
+7.612K
4.58%
jan 1, 1964
181.758K
+8.052K
4.64%
jan 1, 1965
190.244K
+8.486K
4.67%
jan 1, 1966
199.2K
+8.956K
4.71%
jan 1, 1967
208.655K
+9.455K
4.75%
jan 1, 1968
223.713K
+15.058K
7.22%
jan 1, 1969
240.605K
+16.892K
7.55%
jan 1, 1970
258.888K
+18.283K
7.6%
jan 1, 1971
278.664K
+19.776K
7.64%
jan 1, 1972
300.036K
+21.372K
7.67%
jan 1, 1973
323.21K
+23.174K
7.72%
jan 1, 1974
348.281K
+25.071K
7.76%
jan 1, 1975
375.509K
+27.228K
7.82%
jan 1, 1976
405.006K
+29.497K
7.86%
jan 1, 1977
437.205K
+32.199K
7.95%
jan 1, 1978
472.397K
+35.192K
8.05%
jan 1, 1979
501.507K
+29.11K
6.16%
jan 1, 1980
529.279K
+27.772K
5.54%
jan 1, 1981
557.772K
+28.493K
5.38%
jan 1, 1982
586.102K
+28.33K
5.08%
jan 1, 1983
614.707K
+28.605K
4.88%
jan 1, 1984
646.233K
+31.526K
5.13%
jan 1, 1985
684.497K
+38.264K
5.92%
jan 1, 1986
732.309K
+47.812K
6.98%
jan 1, 1987
792.182K
+59.873K
8.18%
jan 1, 1988
862.824K
+70.642K
8.92%
jan 1, 1989
942.614K
+79.79K
9.25%
jan 1, 1990
1.02 mln
+77.473K
8.22%
jan 1, 1991
1.088 mln
+67.593K
6.63%
jan 1, 1992
1.141 mln
+53.779K
4.94%
jan 1, 1993
1.183 mln
+41.6K
3.64%
jan 1, 1994
1.218 mln
+34.77K
2.94%
jan 1, 1995
1.255 mln
+37.456K
3.08%
jan 1, 1996
1.303 mln
+47.515K
3.79%
jan 1, 1997
1.364 mln
+61.022K
4.68%
jan 1, 1998
1.437 mln
+72.842K
5.34%
jan 1, 1999
1.519 mln
+82.798K
5.76%
jan 1, 2000
1.58 mln
+60.901K
4.01%
jan 1, 2001
1.635 mln
+54.968K
3.48%
jan 1, 2002
1.689 mln
+53.737K
3.29%
jan 1, 2003
1.743 mln
+54.014K
3.2%
jan 1, 2004
1.798 mln
+55.376K
3.18%
jan 1, 2005
1.857 mln
+58.218K
3.24%
jan 1, 2006
1.919 mln
+62.385K
3.36%
jan 1, 2007
1.986 mln
+66.678K
3.47%
jan 1, 2008
2.056 mln
+70.739K
3.56%
jan 1, 2009
2.131 mln
+74.552K
3.63%
jan 1, 2010
2.211 mln
+79.513K
3.73%
jan 1, 2011
2.295 mln
+84.688K
3.83%
jan 1, 2012
2.385 mln
+89.745K
3.91%
jan 1, 2013
2.48 mln
+95.379K
4.0%
jan 1, 2014
2.581 mln
+100.999K
4.07%
jan 1, 2015
2.688 mln
+106.916K
4.14%
jan 1, 2016
2.801 mln
+112.993K
4.2%
Ranking of countries by current statistics by years


Comments: