29
/
en
AIzaSyAYiBZKx7MnpbEhh9jyipgxe19OcubqV5w
April 1, 2024
130008
Estonia
EST
true
2
1
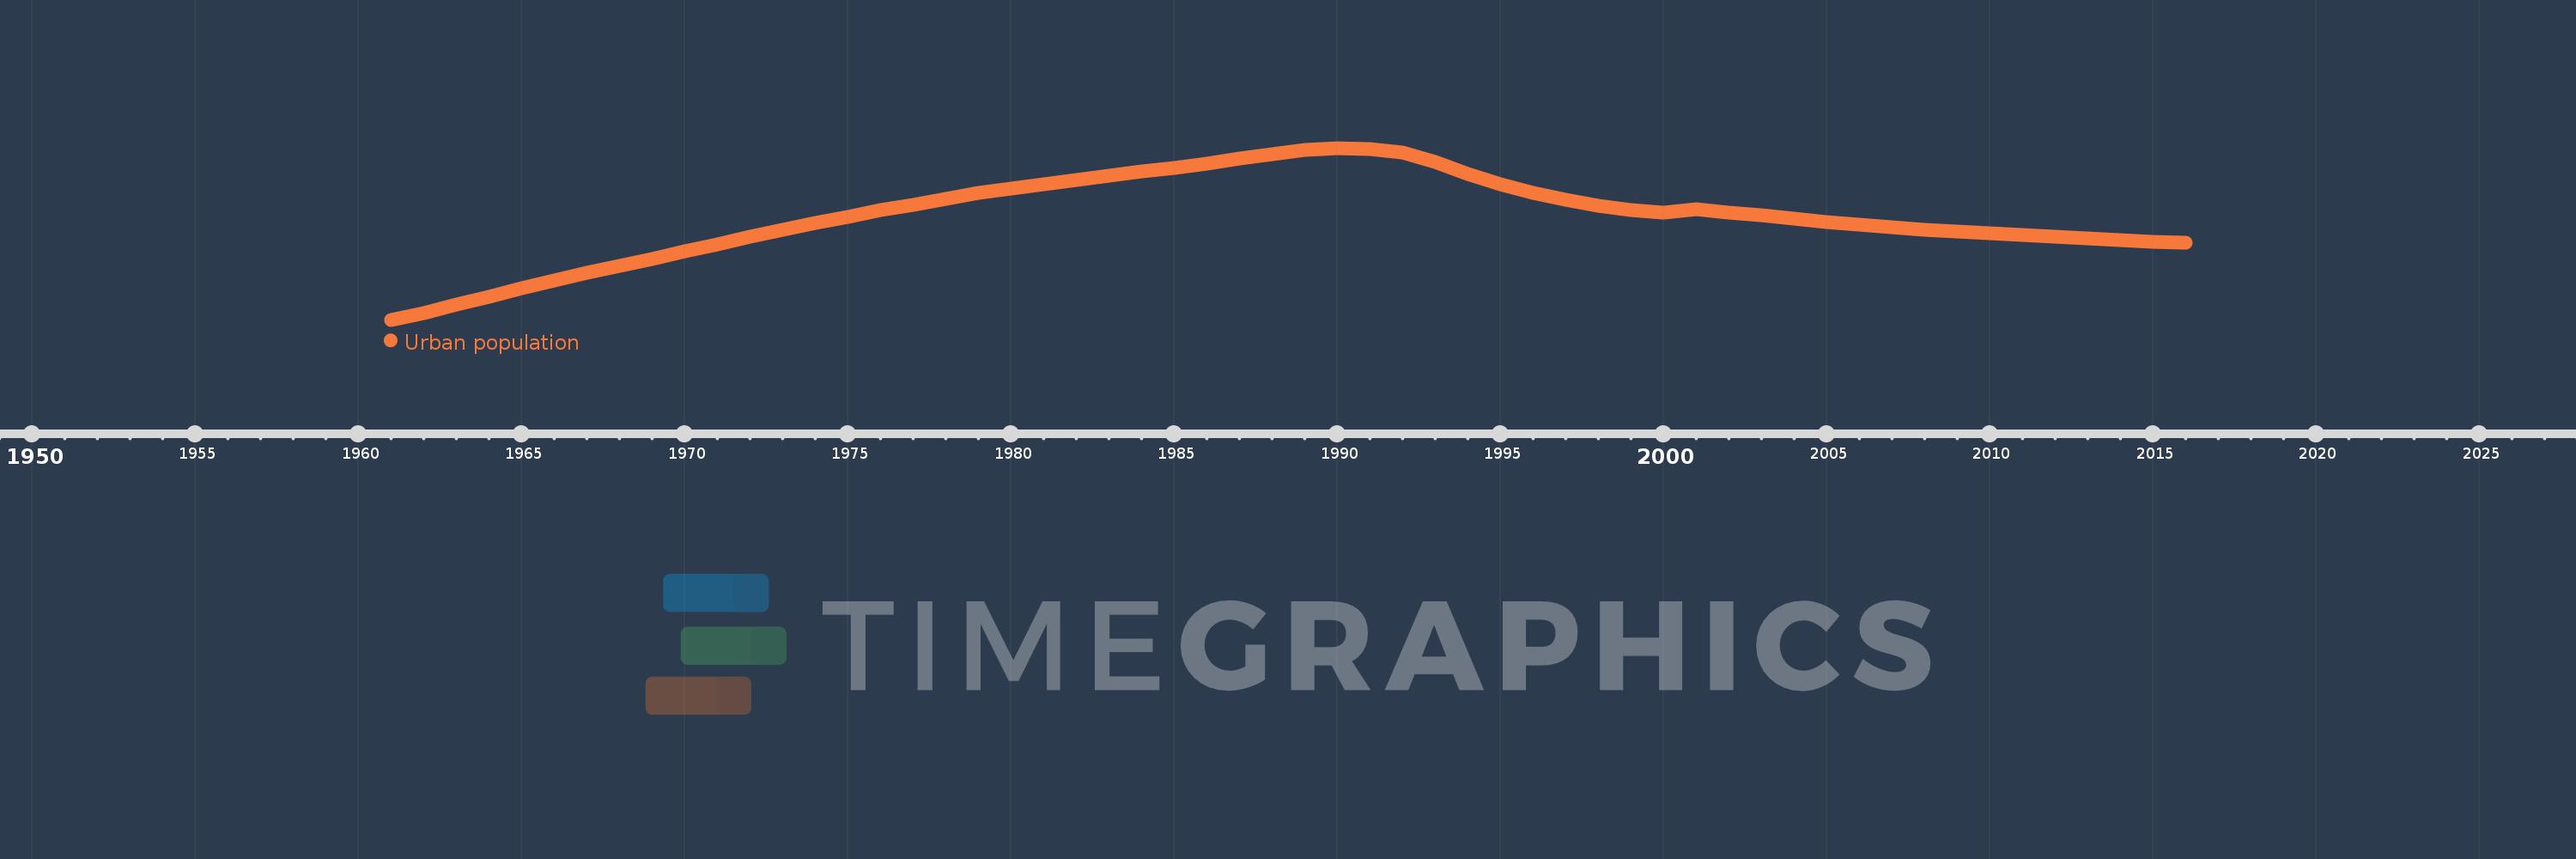
Urban population
2016,2015,2014,2013,2012,2011,2010,2009,2008,2007,2006,2005,2004,2003,2002,2001,2000,1999,1998,1997,1996,1995,1994,1993,1992,1991,1990,1989,1988,1987,1986,1985,1984,1983,1982,1981,1980,1979,1978,1977,1976,1975,1974,1973,1972,1971,1970,1969,1968,1967,1966,1965,1964,1963,1962,1961
This statistics in other country:
AfghanistanAlbaniaAlgeriaAmerican SamoaAndorraAngolaAntigua and BarbudaArab WorldArgentinaArmeniaArubaAustraliaAustriaAzerbaijanBahamas, TheBahrainBangladeshBarbadosBelarusBelgiumBelizeBeninBermudaBhutanBoliviaBosnia and HerzegovinaBotswanaBrazilBritish Virgin IslandsBrunei DarussalamBulgariaBurkina FasoBurundiCabo VerdeCambodiaCameroonCanadaCaribbean small statesCayman IslandsCentral African RepublicCentral Europe and the BalticsChadChannel IslandsChileChinaColombiaComorosCongo, Dem. Rep.Congo, Rep.Costa RicaCote d'IvoireCroatiaCubaCuracaoCyprusCzech RepublicDenmarkDjiboutiDominicaDominican RepublicEarly-demographic dividendEast Asia & PacificEast Asia & Pacific (excluding high income)East Asia & Pacific (IDA & IBRD countries)EcuadorEgypt, Arab Rep.El SalvadorEquatorial GuineaEritreaEstoniaEthiopiaEuro areaEurope & Central AsiaEurope & Central Asia (excluding high income)Europe & Central Asia (IDA & IBRD countries)European UnionFaroe IslandsFijiFinlandFragile and conflict affected situationsFranceFrench PolynesiaGabonGambia, TheGeorgiaGermanyGhanaGibraltarGreeceGreenlandGrenadaGuamGuatemalaGuineaGuinea-BissauGuyanaHaitiHeavily indebted poor countries (HIPC)High incomeHondurasHong Kong SAR, ChinaHungaryIBRD onlyIcelandIDA & IBRD totalIDA blendIDA onlyIDA totalIndiaIndonesiaIran, Islamic Rep.IraqIrelandIsle of ManIsraelItalyJamaicaJapanJordanKazakhstanKenyaKiribatiKorea, Dem. People’s Rep.Korea, Rep.KuwaitKyrgyz RepublicLao PDRLate-demographic dividendLatin America & Caribbean Latin America & Caribbean (excluding high income)Latin America & the Caribbean (IDA & IBRD countries)LatviaLeast developed countries: UN classificationLebanonLesothoLiberiaLibyaLiechtensteinLithuaniaLow & middle incomeLow incomeLower middle incomeLuxembourgMacao SAR, ChinaMacedonia, FYRMadagascarMalawiMalaysiaMaldivesMaliMaltaMarshall IslandsMauritaniaMauritiusMexicoMicronesia, Fed. Sts.Middle East & North AfricaMiddle East & North Africa (excluding high income)Middle East & North Africa (IDA & IBRD countries)Middle incomeMoldovaMonacoMongoliaMontenegroMoroccoMozambiqueMyanmarNamibiaNauruNepalNetherlandsNew CaledoniaNew ZealandNicaraguaNigerNigeriaNorth AmericaNorthern Mariana IslandsNorwayOECD membersOmanOther small statesPacific island small statesPakistanPalauPanamaPapua New GuineaParaguayPeruPhilippinesPolandPortugalPost-demographic dividendPre-demographic dividendPuerto RicoQatarRomaniaRussian FederationRwandaSamoaSan MarinoSao Tome and PrincipeSaudi ArabiaSenegalSerbiaSeychellesSierra LeoneSingaporeSint Maarten (Dutch part)Slovak RepublicSloveniaSmall statesSolomon IslandsSomaliaSouth AfricaSouth AsiaSouth Asia (IDA & IBRD)South SudanSpainSri LankaSt. Kitts and NevisSt. LuciaSt. Vincent and the GrenadinesSub-Saharan Africa Sub-Saharan Africa (excluding high income)Sub-Saharan Africa (IDA & IBRD countries)SudanSurinameSwazilandSwedenSwitzerlandSyrian Arab RepublicTajikistanTanzaniaThailandTimor-LesteTogoTongaTrinidad and TobagoTunisiaTurkeyTurkmenistanTurks and Caicos IslandsTuvaluUgandaUkraineUnited Arab EmiratesUnited KingdomUnited StatesUpper middle incomeUruguayUzbekistanVanuatuVenezuela, RBVietnamVirgin Islands (U.S.)West Bank and GazaWorldYemen, Rep.ZambiaZimbabwe Timeline:
This timeline shows a graph from 1961 to 2016 of Estonia. No data until 1960. Number of actual observations by date: 56.
Source name:
World Development Indicators
Source organization:
World Bank Staff estimates based on United Nations, World Urbanization Prospects.
Categories, topics:
Climate Change, Urban Development
Last updated:
apr 23, 2017
Indicators value changes by year
Minimum:
697.034K
jan 1, 1961
Maximum:
1.12 mln
jan 1, 1990
At the date of observation
Value
Absolute change
Change from previous value
jan 1, 1961
697.034K
+697.034K
0.0%
jan 1, 1962
714.269K
+17.235K
2.47%
jan 1, 1963
733.452K
+19.183K
2.69%
jan 1, 1964
753.25K
+19.798K
2.7%
jan 1, 1965
773.863K
+20.613K
2.74%
jan 1, 1966
794.19K
+20.327K
2.63%
jan 1, 1967
812.599K
+18.409K
2.32%
jan 1, 1968
828.812K
+16.213K
2.0%
jan 1, 1969
846.346K
+17.534K
2.12%
jan 1, 1970
865.089K
+18.743K
2.21%
jan 1, 1971
883.329K
+18.24K
2.11%
jan 1, 1972
901.671K
+18.342K
2.08%
jan 1, 1973
919.299K
+17.628K
1.96%
jan 1, 1974
935.59K
+16.291K
1.77%
jan 1, 1975
951.152K
+15.562K
1.66%
jan 1, 1976
966.085K
+14.933K
1.57%
jan 1, 1977
980.438K
+14.353K
1.49%
jan 1, 1978
995.091K
+14.653K
1.49%
jan 1, 1979
1.009 mln
+14.249K
1.43%
jan 1, 1980
1.02 mln
+11.107K
1.1%
jan 1, 1981
1.03 mln
+9.337K
0.91%
jan 1, 1982
1.04 mln
+10.452K
1.01%
jan 1, 1983
1.051 mln
+10.692K
1.03%
jan 1, 1984
1.061 mln
+10.429K
0.99%
jan 1, 1985
1.072 mln
+10.149K
0.96%
jan 1, 1986
1.082 mln
+10.366K
0.97%
jan 1, 1987
1.093 mln
+11.278K
1.04%
jan 1, 1988
1.105 mln
+11.767K
1.08%
jan 1, 1989
1.115 mln
+10.123K
0.92%
jan 1, 1990
1.12 mln
+4.841K
0.43%
jan 1, 1991
1.118 mln
-2.143K
-0.19%
jan 1, 1992
1.109 mln
-8.487K
-0.76%
jan 1, 1993
1.086 mln
-22.903K
-2.06%
jan 1, 1994
1.056 mln
-30.388K
-2.8%
jan 1, 1995
1.031 mln
-25.078K
-2.37%
jan 1, 1996
1.01 mln
-20.928K
-2.03%
jan 1, 1997
992.487K
-17.467K
-1.73%
jan 1, 1998
978.597K
-13.89K
-1.4%
jan 1, 1999
966.608K
-11.989K
-1.23%
jan 1, 2000
960.125K
-6.483K
-0.67%
jan 1, 2001
969.061K
+8.936K
0.93%
jan 1, 2002
961.159K
-7.902K
-0.82%
jan 1, 2003
953.352K
-7.807K
-0.81%
jan 1, 2004
945.646K
-7.706K
-0.81%
jan 1, 2005
938.279K
-7.367K
-0.78%
jan 1, 2006
931.205K
-7.074K
-0.75%
jan 1, 2007
924.006K
-7.199K
-0.77%
jan 1, 2008
918.084K
-5.922K
-0.64%
jan 1, 2009
913.914K
-4.17K
-0.45%
jan 1, 2010
910.446K
-3.468K
-0.38%
jan 1, 2011
906.655K
-3.791K
-0.42%
jan 1, 2012
902.194K
-4.461K
-0.49%
jan 1, 2013
897.251K
-4.943K
-0.55%
jan 1, 2014
892.561K
-4.69K
-0.52%
jan 1, 2015
888.922K
-3.639K
-0.41%
jan 1, 2016
886.097K
-2.825K
-0.32%
Ranking of countries by current statistics by years


Comments: