29
/
en
AIzaSyAYiBZKx7MnpbEhh9jyipgxe19OcubqV5w
April 1, 2024
197601
Moldova
MDA
true
2
1
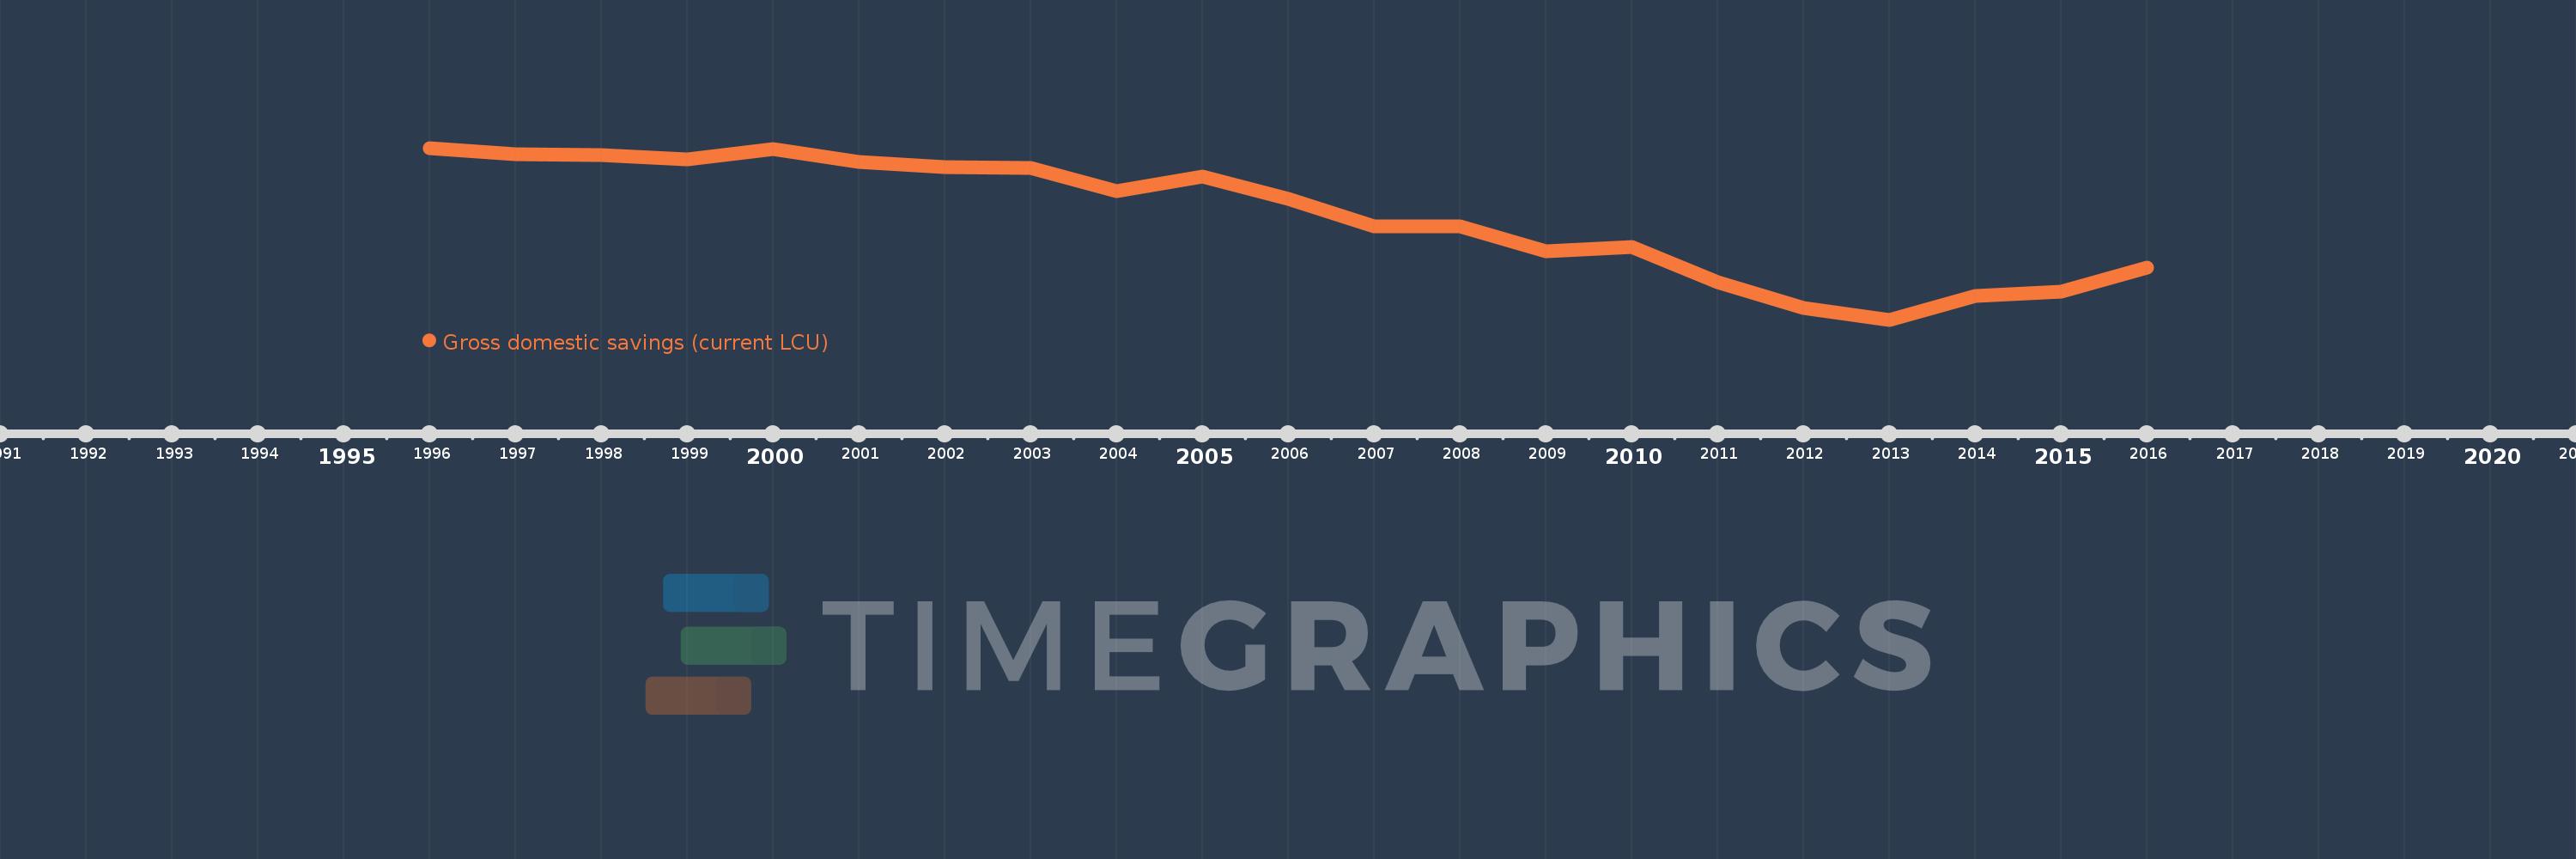
Gross domestic savings (current LCU)
2016,2015,2014,2013,2012,2011,2010,2009,2008,2007,2006,2005,2004,2003,2002,2001,2000,1999,1998,1997,1996
This statistics in other country:
AfghanistanAlbaniaAlgeriaAngolaAntigua and BarbudaArgentinaArmeniaArubaAustraliaAustriaAzerbaijanBahamas, TheBahrainBangladeshBarbadosBelarusBelgiumBelizeBeninBermudaBhutanBoliviaBosnia and HerzegovinaBotswanaBrazilBrunei DarussalamBulgariaBurkina FasoBurundiCabo VerdeCambodiaCameroonCanadaCentral African RepublicChadChileChinaColombiaComorosCongo, Dem. Rep.Congo, Rep.Costa RicaCote d'IvoireCroatiaCubaCyprusCzech RepublicDenmarkDjiboutiDominicaDominican RepublicEcuadorEgypt, Arab Rep.El SalvadorEquatorial GuineaEritreaEstoniaEthiopiaFaroe IslandsFijiFinlandFranceGabonGambia, TheGeorgiaGermanyGhanaGreeceGrenadaGuatemalaGuineaGuinea-BissauGuyanaHaitiHondurasHong Kong SAR, ChinaHungaryIcelandIndiaIndonesiaIran, Islamic Rep.IraqIrelandIsraelItalyJamaicaJapanJordanKazakhstanKenyaKiribatiKorea, Rep.KosovoKuwaitKyrgyz RepublicLao PDRLatviaLebanonLesothoLiberiaLibyaLithuaniaLuxembourgMacao SAR, ChinaMacedonia, FYRMadagascarMalawiMalaysiaMaldivesMaliMaltaMauritaniaMauritiusMexicoMicronesia, Fed. Sts.MoldovaMongoliaMontenegroMoroccoMozambiqueNamibiaNepalNetherlandsNew CaledoniaNew ZealandNicaraguaNigerNigeriaNorwayOmanPakistanPanamaPapua New GuineaParaguayPeruPhilippinesPolandPortugalPuerto RicoQatarRomaniaRussian FederationRwandaSaudi ArabiaSenegalSerbiaSeychellesSierra LeoneSingaporeSlovak RepublicSloveniaSolomon IslandsSomaliaSouth AfricaSouth SudanSpainSri LankaSt. Kitts and NevisSt. LuciaSt. Vincent and the GrenadinesSudanSurinameSwazilandSwedenSwitzerlandSyrian Arab RepublicTajikistanTanzaniaThailandTimor-LesteTogoTongaTrinidad and TobagoTunisiaTurkeyTurkmenistanUgandaUkraineUnited Arab EmiratesUnited KingdomUnited StatesUruguayUzbekistanVanuatuVenezuela, RBVietnamWest Bank and GazaYemen, Rep.ZambiaZimbabwe Timeline:
This timeline shows a graph from 1996 to 2016 of Moldova. No data until 1995. Number of actual observations by date: 21.
Source name:
World Development Indicators
Source organization:
World Bank national accounts data, and OECD National Accounts data files.
Categories, topics:
Economy & Growth
Last updated:
apr 23, 2017
Indicators value changes by year
Minimum:
-14.835 bln
jan 1, 2013
Maximum:
1.054 bln
jan 1, 1996
At the date of observation
Value
Absolute change
Change from previous value
jan 1, 1996
1.054 bln
+1.054 bln
0.0%
jan 1, 1997
436.456 mln
-617.405 mln
-58.59%
jan 1, 1998
385.463 mln
-50.993 mln
-11.68%
jan 1, 1999
25.637 mln
-359.826 mln
-93.35%
jan 1, 2000
930.396 mln
+904.759 mln
3.53K%
jan 1, 2001
-273.412 mln
-1.204 bln
-129.39%
jan 1, 2002
-700.715 mln
-427.303 mln
156.29%
jan 1, 2003
-796.968 mln
-96.253 mln
13.74%
jan 1, 2004
-2.925 bln
-2.128 bln
266.95%
jan 1, 2005
-1.581 bln
+1.344 bln
-45.96%
jan 1, 2006
-3.653 bln
-2.072 bln
131.12%
jan 1, 2007
-6.218 bln
-2.565 bln
70.22%
jan 1, 2008
-6.188 bln
+29.633 mln
-0.48%
jan 1, 2009
-8.53 bln
-2.341 bln
37.83%
jan 1, 2010
-8.144 bln
+385.587 mln
-4.52%
jan 1, 2011
-11.355 bln
-3.21 bln
39.42%
jan 1, 2012
-13.742 bln
-2.388 bln
21.03%
jan 1, 2013
-14.835 bln
-1.093 bln
7.95%
jan 1, 2014
-12.659 bln
+2.176 bln
-14.67%
jan 1, 2015
-12.249 bln
+409.748 mln
-3.24%
jan 1, 2016
-10.043 bln
+2.206 bln
-18.01%
Ranking of countries by current statistics by years


Comments: