29
/
en
AIzaSyAYiBZKx7MnpbEhh9jyipgxe19OcubqV5w
April 1, 2024
79501
Barbados
BRB
true
2
1
Gross domestic savings (current LCU)
2016,2015,2014,2013,2012,2011,2010,2009,2008,2007,2006,2005,2004,2003,2002,2001,2000,1999,1998,1997,1996,1995,1994,1993,1992,1991,1990,1989,1988,1987,1986,1985,1984,1983,1982,1981
This statistics in other country:
AfghanistanAlbaniaAlgeriaAngolaAntigua and BarbudaArgentinaArmeniaArubaAustraliaAustriaAzerbaijanBahamas, TheBahrainBangladeshBarbadosBelarusBelgiumBelizeBeninBermudaBhutanBoliviaBosnia and HerzegovinaBotswanaBrazilBrunei DarussalamBulgariaBurkina FasoBurundiCabo VerdeCambodiaCameroonCanadaCentral African RepublicChadChileChinaColombiaComorosCongo, Dem. Rep.Congo, Rep.Costa RicaCote d'IvoireCroatiaCubaCyprusCzech RepublicDenmarkDjiboutiDominicaDominican RepublicEcuadorEgypt, Arab Rep.El SalvadorEquatorial GuineaEritreaEstoniaEthiopiaFaroe IslandsFijiFinlandFranceGabonGambia, TheGeorgiaGermanyGhanaGreeceGrenadaGuatemalaGuineaGuinea-BissauGuyanaHaitiHondurasHong Kong SAR, ChinaHungaryIcelandIndiaIndonesiaIran, Islamic Rep.IraqIrelandIsraelItalyJamaicaJapanJordanKazakhstanKenyaKiribatiKorea, Rep.KosovoKuwaitKyrgyz RepublicLao PDRLatviaLebanonLesothoLiberiaLibyaLithuaniaLuxembourgMacao SAR, ChinaMacedonia, FYRMadagascarMalawiMalaysiaMaldivesMaliMaltaMauritaniaMauritiusMexicoMicronesia, Fed. Sts.MoldovaMongoliaMontenegroMoroccoMozambiqueNamibiaNepalNetherlandsNew CaledoniaNew ZealandNicaraguaNigerNigeriaNorwayOmanPakistanPanamaPapua New GuineaParaguayPeruPhilippinesPolandPortugalPuerto RicoQatarRomaniaRussian FederationRwandaSaudi ArabiaSenegalSerbiaSeychellesSierra LeoneSingaporeSlovak RepublicSloveniaSolomon IslandsSomaliaSouth AfricaSouth SudanSpainSri LankaSt. Kitts and NevisSt. LuciaSt. Vincent and the GrenadinesSudanSurinameSwazilandSwedenSwitzerlandSyrian Arab RepublicTajikistanTanzaniaThailandTimor-LesteTogoTongaTrinidad and TobagoTunisiaTurkeyTurkmenistanUgandaUkraineUnited Arab EmiratesUnited KingdomUnited StatesUruguayUzbekistanVanuatuVenezuela, RBVietnamWest Bank and GazaYemen, Rep.ZambiaZimbabwe Timeline:
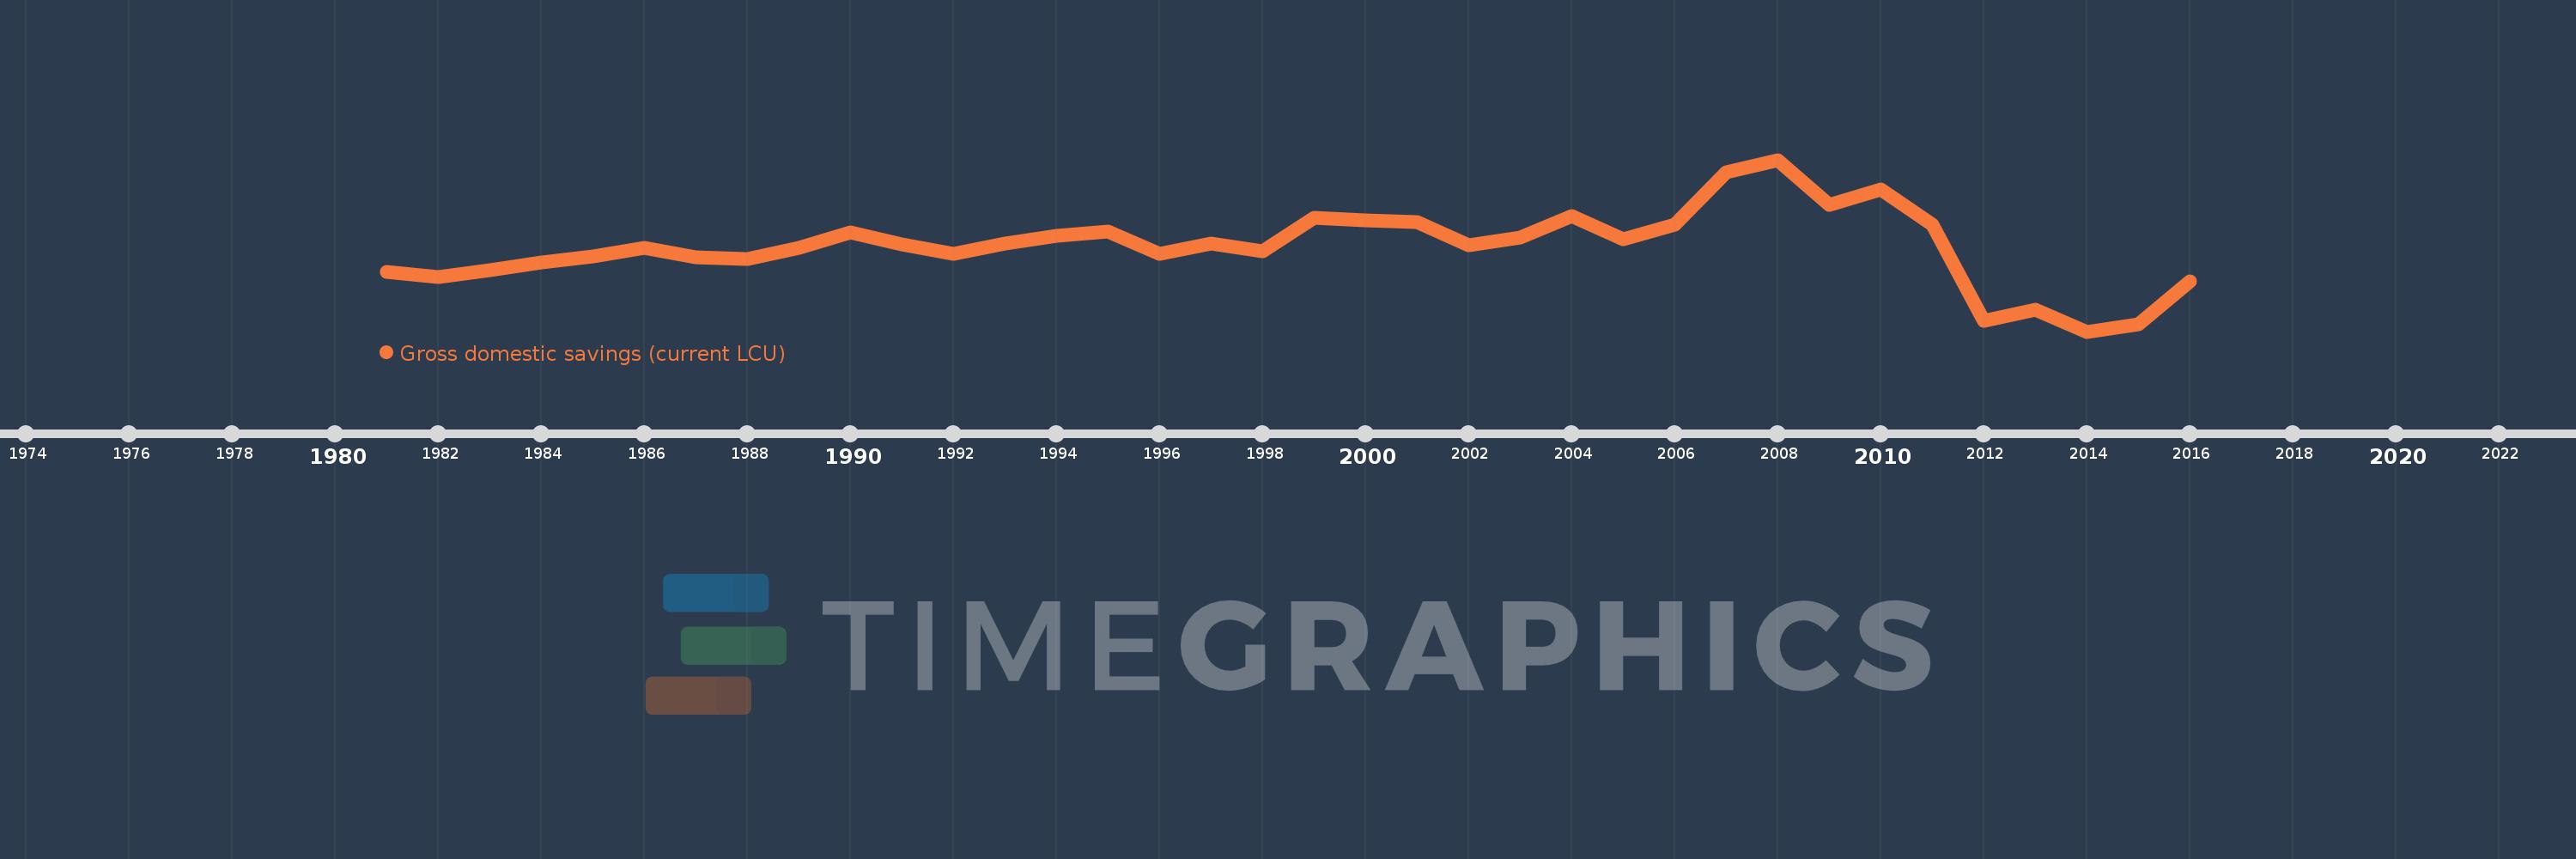
This timeline shows a graph from 1981 to 2016 of Barbados. No data until 1980. Number of actual observations by date: 36.
Source name:
World Development Indicators
Source organization:
World Bank national accounts data, and OECD National Accounts data files.
Categories, topics:
Economy & Growth
Last updated:
apr 23, 2017
Indicators value changes by year
Minimum:
37.612 mln
jan 1, 2014
Maximum:
1.323 bln
jan 1, 2008
At the date of observation
Value
Absolute change
Change from previous value
jan 1, 1981
485.366 mln
+485.366 mln
0.0%
jan 1, 1982
445.938 mln
-39.428 mln
-8.12%
jan 1, 1983
496.568 mln
+50.63 mln
11.35%
jan 1, 1984
556.983 mln
+60.415 mln
12.17%
jan 1, 1985
601.794 mln
+44.811 mln
8.05%
jan 1, 1986
665.266 mln
+63.472 mln
10.55%
jan 1, 1987
592.701 mln
-72.565 mln
-10.91%
jan 1, 1988
578.906 mln
-13.795 mln
-2.33%
jan 1, 1989
666.326 mln
+87.42 mln
15.1%
jan 1, 1990
779.259 mln
+112.933 mln
16.95%
jan 1, 1991
689.179 mln
-90.079 mln
-11.56%
jan 1, 1992
618.292 mln
-70.888 mln
-10.29%
jan 1, 1993
695.252 mln
+76.96 mln
12.45%
jan 1, 1994
752.7 mln
+57.448 mln
8.26%
jan 1, 1995
786.1 mln
+33.4 mln
4.44%
jan 1, 1996
620.8 mln
-165.3 mln
-21.03%
jan 1, 1997
697.8 mln
+77.0 mln
12.4%
jan 1, 1998
635.5 mln
-62.3 mln
-8.93%
jan 1, 1999
887.2 mln
+251.7 mln
39.61%
jan 1, 2000
872.4 mln
-14.8 mln
-1.67%
jan 1, 2001
856.7 mln
-15.7 mln
-1.8%
jan 1, 2002
684.7 mln
-172.0 mln
-20.08%
jan 1, 2003
739.5 mln
+54.8 mln
8.0%
jan 1, 2004
904.4 mln
+164.9 mln
22.3%
jan 1, 2005
727.7 mln
-176.7 mln
-19.54%
jan 1, 2006
835.1 mln
+107.4 mln
14.76%
jan 1, 2007
1.23 bln
+394.7 mln
47.26%
jan 1, 2008
1.323 bln
+93.1 mln
7.57%
jan 1, 2009
986.8 mln
-336.1 mln
-25.41%
jan 1, 2010
1.101 bln
+114.472 mln
11.6%
jan 1, 2011
835.32 mln
-265.952 mln
-24.15%
jan 1, 2012
120.087 mln
-715.234 mln
-85.62%
jan 1, 2013
199.822 mln
+79.735 mln
66.4%
jan 1, 2014
37.612 mln
-162.209 mln
-81.18%
jan 1, 2015
90.2 mln
+52.588 mln
139.82%
jan 1, 2016
415.115 mln
+324.915 mln
360.22%
Ranking of countries by current statistics by years


Comments: