29
/
en
AIzaSyAYiBZKx7MnpbEhh9jyipgxe19OcubqV5w
April 1, 2024
109721
Congo, Dem. Rep.
COD
true
2
1
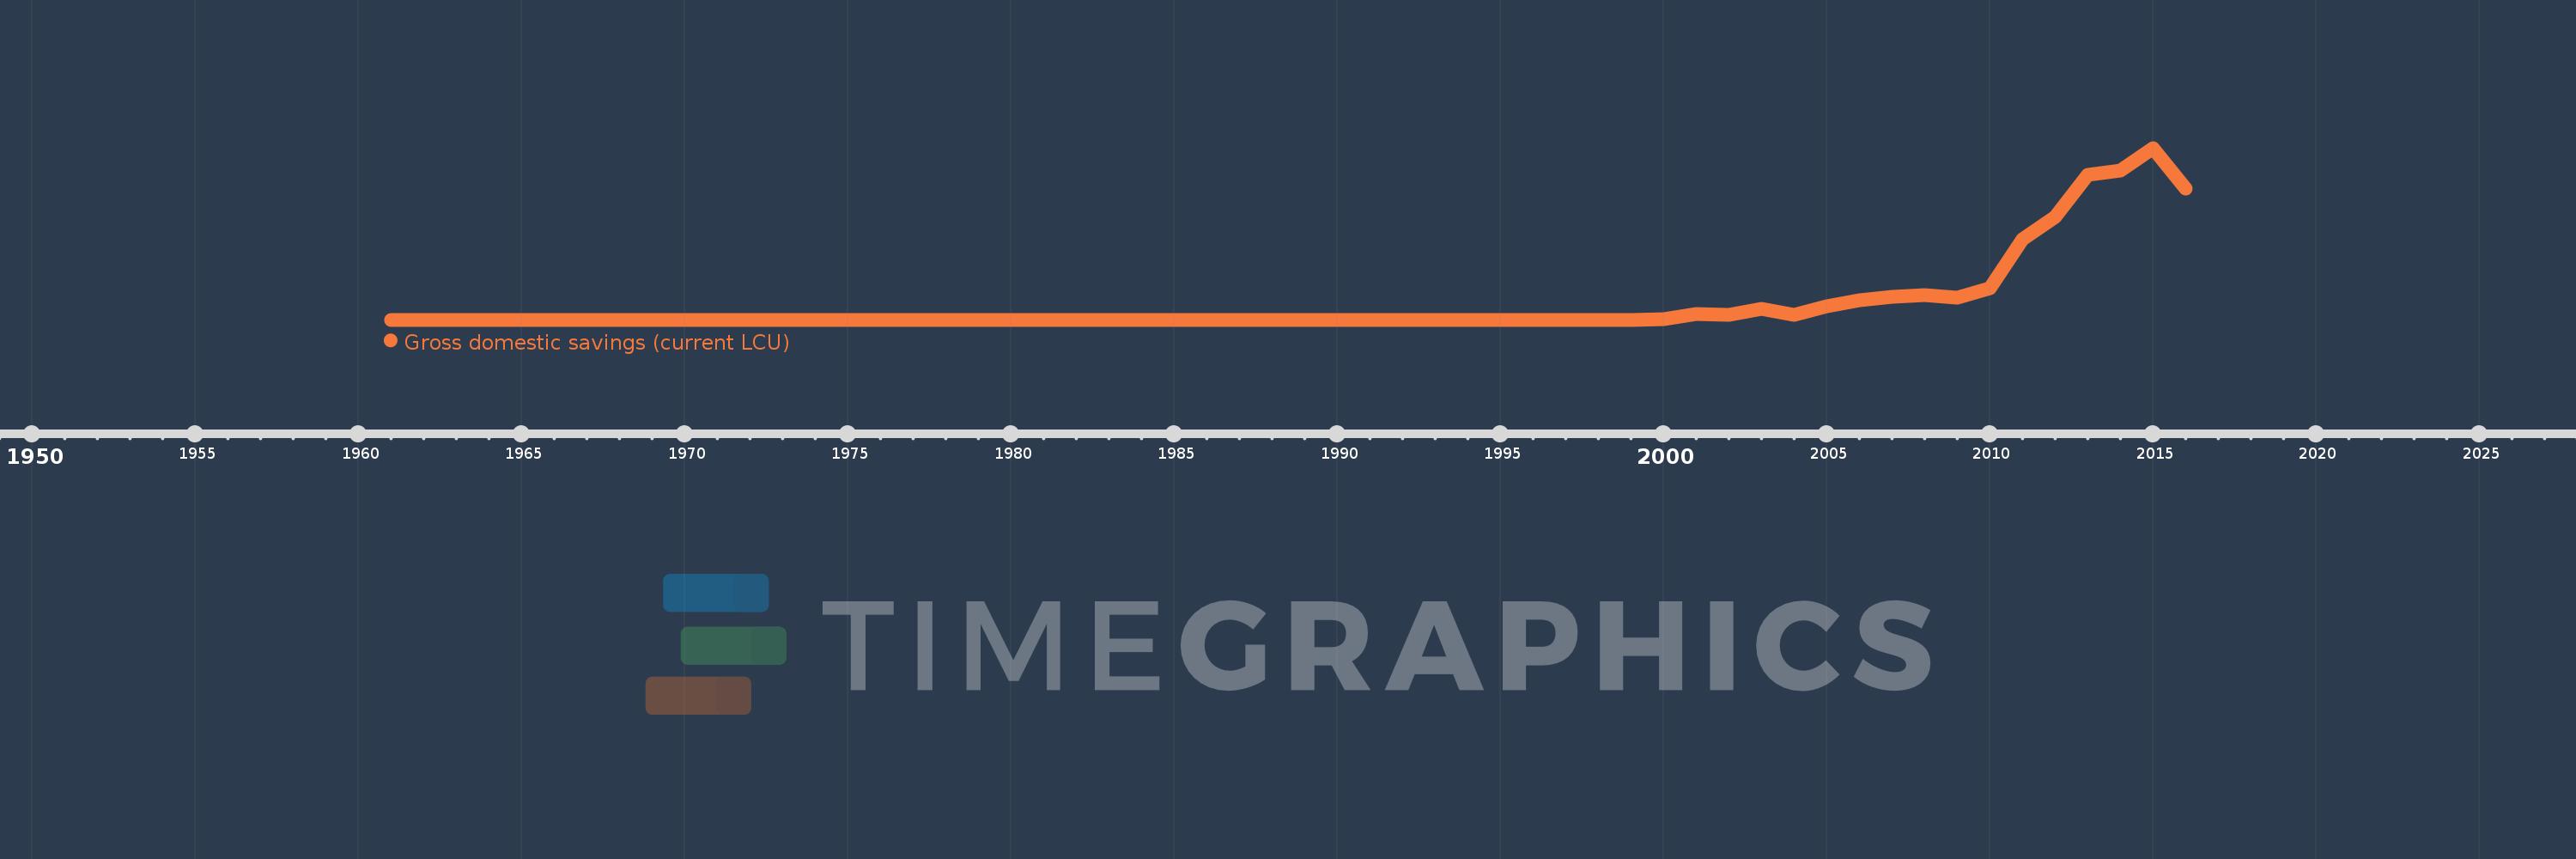
Gross domestic savings (current LCU)
2016,2015,2014,2013,2012,2011,2010,2009,2008,2007,2006,2005,2004,2003,2002,2001,2000,1999,1998,1997,1996,1995,1994,1993,1992,1991,1990,1989,1988,1987,1986,1985,1984,1983,1982,1981,1980,1979,1978,1977,1976,1975,1974,1973,1972,1971,1970,1969,1968,1967,1966,1965,1964,1963,1962,1961
This statistics in other country:
AfghanistanAlbaniaAlgeriaAngolaAntigua and BarbudaArgentinaArmeniaArubaAustraliaAustriaAzerbaijanBahamas, TheBahrainBangladeshBarbadosBelarusBelgiumBelizeBeninBermudaBhutanBoliviaBosnia and HerzegovinaBotswanaBrazilBrunei DarussalamBulgariaBurkina FasoBurundiCabo VerdeCambodiaCameroonCanadaCentral African RepublicChadChileChinaColombiaComorosCongo, Dem. Rep.Congo, Rep.Costa RicaCote d'IvoireCroatiaCubaCyprusCzech RepublicDenmarkDjiboutiDominicaDominican RepublicEcuadorEgypt, Arab Rep.El SalvadorEquatorial GuineaEritreaEstoniaEthiopiaFaroe IslandsFijiFinlandFranceGabonGambia, TheGeorgiaGermanyGhanaGreeceGrenadaGuatemalaGuineaGuinea-BissauGuyanaHaitiHondurasHong Kong SAR, ChinaHungaryIcelandIndiaIndonesiaIran, Islamic Rep.IraqIrelandIsraelItalyJamaicaJapanJordanKazakhstanKenyaKiribatiKorea, Rep.KosovoKuwaitKyrgyz RepublicLao PDRLatviaLebanonLesothoLiberiaLibyaLithuaniaLuxembourgMacao SAR, ChinaMacedonia, FYRMadagascarMalawiMalaysiaMaldivesMaliMaltaMauritaniaMauritiusMexicoMicronesia, Fed. Sts.MoldovaMongoliaMontenegroMoroccoMozambiqueNamibiaNepalNetherlandsNew CaledoniaNew ZealandNicaraguaNigerNigeriaNorwayOmanPakistanPanamaPapua New GuineaParaguayPeruPhilippinesPolandPortugalPuerto RicoQatarRomaniaRussian FederationRwandaSaudi ArabiaSenegalSerbiaSeychellesSierra LeoneSingaporeSlovak RepublicSloveniaSolomon IslandsSomaliaSouth AfricaSouth SudanSpainSri LankaSt. Kitts and NevisSt. LuciaSt. Vincent and the GrenadinesSudanSurinameSwazilandSwedenSwitzerlandSyrian Arab RepublicTajikistanTanzaniaThailandTimor-LesteTogoTongaTrinidad and TobagoTunisiaTurkeyTurkmenistanUgandaUkraineUnited Arab EmiratesUnited KingdomUnited StatesUruguayUzbekistanVanuatuVenezuela, RBVietnamWest Bank and GazaYemen, Rep.ZambiaZimbabwe Timeline:
This timeline shows a graph from 1961 to 2016 of Congo, Dem. Rep.. No data until 1960. Number of actual observations by date: 56.
Source name:
World Development Indicators
Source organization:
World Bank national accounts data, and OECD National Accounts data files.
Categories, topics:
Economy & Growth
Last updated:
apr 23, 2017
Indicators value changes by year
Minimum:
-99.812 mln
jan 1, 1999
Maximum:
4.345 trl
jan 1, 2015
At the date of observation
Value
Absolute change
Change from previous value
jan 1, 1962
0.0
+0.0
11.94%
jan 1, 1963
0.0
0.0
-17.52%
jan 1, 1964
0.0
+0.0
740.35%
jan 1, 1965
0.0
0.0
-18.21%
jan 1, 1966
0.0
+0.0
48.4%
jan 1, 1967
0.0
0.0
-89.73%
jan 1, 1968
0.0
+0.0
1.13K%
jan 1, 1969
0.001
+0.0
55.82%
jan 1, 1970
0.001
+0.0
44.94%
jan 1, 1971
0.001
+0.0
0.04%
jan 1, 1972
0.001
+0.0
13.16%
jan 1, 1973
0.001
+0.0
29.9%
jan 1, 1974
0.002
+0.0
28.97%
jan 1, 1975
0.002
+0.0
21.59%
jan 1, 1976
0.002
0.0
-4.95%
jan 1, 1977
0.002
0.0
-18.1%
jan 1, 1978
0.004
+0.002
138.95%
jan 1, 1979
0.006
+0.002
52.14%
jan 1, 1980
0.013
+0.007
106.2%
jan 1, 1981
0.014
+0.0
1.66%
jan 1, 1982
0.014
+0.0
1.43%
jan 1, 1983
0.017
+0.003
24.1%
jan 1, 1984
0.039
+0.022
129.43%
jan 1, 1985
0.098
+0.059
151.29%
jan 1, 1986
0.172
+0.074
74.96%
jan 1, 1987
0.223
+0.051
29.83%
jan 1, 1988
0.324
+0.101
45.05%
jan 1, 1989
0.669
+0.345
106.52%
jan 1, 1990
1.715
+1.046
156.44%
jan 1, 1991
2.093
+0.378
22.06%
jan 1, 1992
8.644
+6.551
312.95%
jan 1, 1993
1.069K
+1.06K
12.26K%
jan 1, 1994
10.721K
+9.652K
903.09%
jan 1, 1995
7.391 mln
+7.38 mln
68.84K%
jan 1, 1996
56.013 mln
+48.622 mln
657.88%
jan 1, 1997
797.7 mln
+741.687 mln
1.32K%
jan 1, 1998
500.0 mln
-297.7 mln
-37.32%
jan 1, 1999
-99.812 mln
-599.812 mln
-119.96%
jan 1, 2000
4.748 bln
+4.848 bln
-4.86K%
jan 1, 2001
135.9 bln
+131.152 bln
2.76K%
jan 1, 2002
125.8 bln
-10.1 bln
-7.43%
jan 1, 2003
286.3 bln
+160.5 bln
127.58%
jan 1, 2004
126.6 bln
-159.7 bln
-55.78%
jan 1, 2005
344.7 bln
+218.1 bln
172.27%
jan 1, 2006
489.5 bln
+144.8 bln
42.01%
jan 1, 2007
590.6 bln
+101.1 bln
20.65%
jan 1, 2008
616.499 bln
+25.899 bln
4.39%
jan 1, 2009
568.9 bln
-47.599 bln
-7.72%
jan 1, 2010
791.999 bln
+223.099 bln
39.22%
jan 1, 2011
2.043 trl
+1.251 trl
157.92%
jan 1, 2012
2.608 trl
+565.691 bln
27.69%
jan 1, 2013
3.672 trl
+1.064 trl
40.78%
jan 1, 2014
3.782 trl
+109.992 bln
3.0%
jan 1, 2015
4.345 trl
+562.755 bln
14.88%
jan 1, 2016
3.315 trl
-1.029 trl
-23.69%
Ranking of countries by current statistics by years


Comments: