29
/
en
AIzaSyAYiBZKx7MnpbEhh9jyipgxe19OcubqV5w
April 1, 2024
183914
Macedonia, FYR
MKD
true
2
1
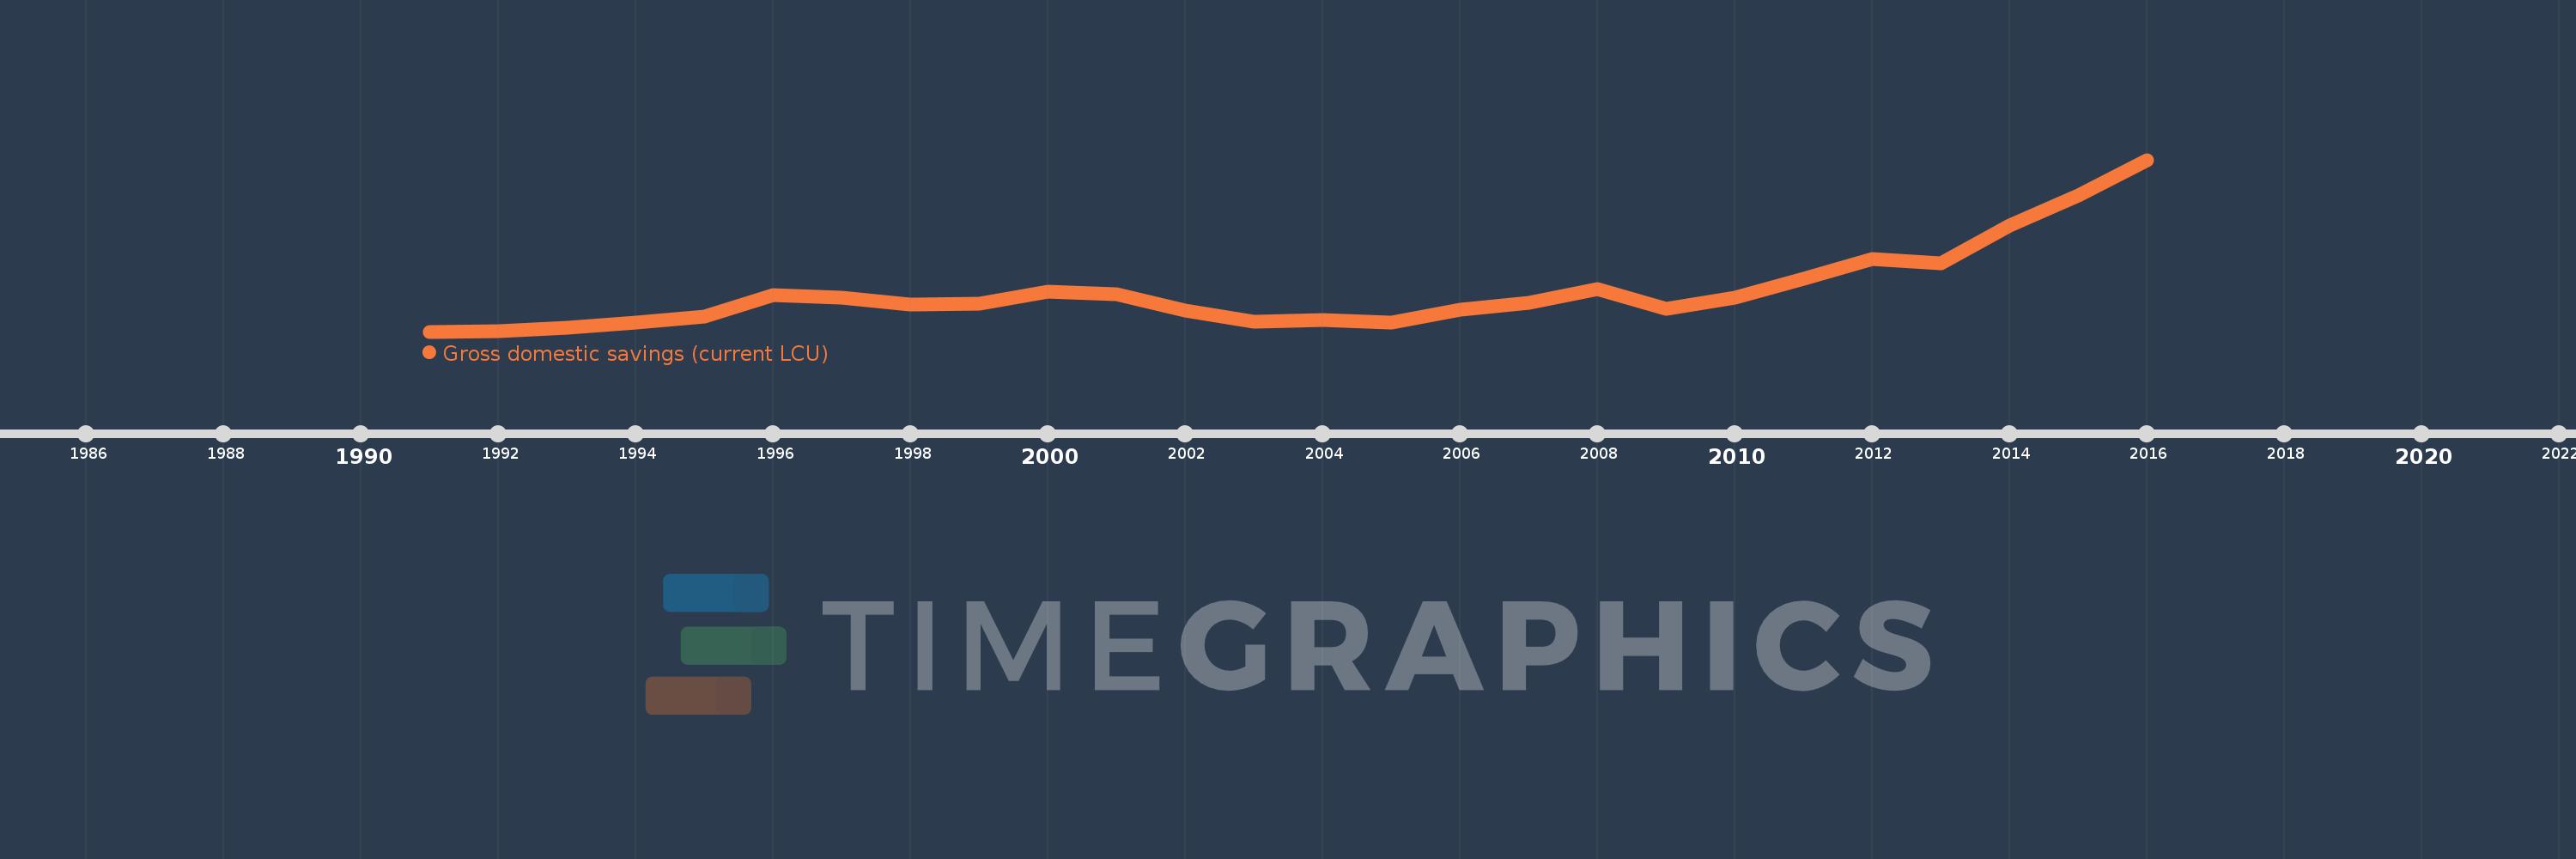
Gross domestic savings (current LCU)
2016,2015,2014,2013,2012,2011,2010,2009,2008,2007,2006,2005,2004,2003,2002,2001,2000,1999,1998,1997,1996,1995,1994,1993,1992,1991
This statistics in other country:
AfghanistanAlbaniaAlgeriaAngolaAntigua and BarbudaArgentinaArmeniaArubaAustraliaAustriaAzerbaijanBahamas, TheBahrainBangladeshBarbadosBelarusBelgiumBelizeBeninBermudaBhutanBoliviaBosnia and HerzegovinaBotswanaBrazilBrunei DarussalamBulgariaBurkina FasoBurundiCabo VerdeCambodiaCameroonCanadaCentral African RepublicChadChileChinaColombiaComorosCongo, Dem. Rep.Congo, Rep.Costa RicaCote d'IvoireCroatiaCubaCyprusCzech RepublicDenmarkDjiboutiDominicaDominican RepublicEcuadorEgypt, Arab Rep.El SalvadorEquatorial GuineaEritreaEstoniaEthiopiaFaroe IslandsFijiFinlandFranceGabonGambia, TheGeorgiaGermanyGhanaGreeceGrenadaGuatemalaGuineaGuinea-BissauGuyanaHaitiHondurasHong Kong SAR, ChinaHungaryIcelandIndiaIndonesiaIran, Islamic Rep.IraqIrelandIsraelItalyJamaicaJapanJordanKazakhstanKenyaKiribatiKorea, Rep.KosovoKuwaitKyrgyz RepublicLao PDRLatviaLebanonLesothoLiberiaLibyaLithuaniaLuxembourgMacao SAR, ChinaMacedonia, FYRMadagascarMalawiMalaysiaMaldivesMaliMaltaMauritaniaMauritiusMexicoMicronesia, Fed. Sts.MoldovaMongoliaMontenegroMoroccoMozambiqueNamibiaNepalNetherlandsNew CaledoniaNew ZealandNicaraguaNigerNigeriaNorwayOmanPakistanPanamaPapua New GuineaParaguayPeruPhilippinesPolandPortugalPuerto RicoQatarRomaniaRussian FederationRwandaSaudi ArabiaSenegalSerbiaSeychellesSierra LeoneSingaporeSlovak RepublicSloveniaSolomon IslandsSomaliaSouth AfricaSouth SudanSpainSri LankaSt. Kitts and NevisSt. LuciaSt. Vincent and the GrenadinesSudanSurinameSwazilandSwedenSwitzerlandSyrian Arab RepublicTajikistanTanzaniaThailandTimor-LesteTogoTongaTrinidad and TobagoTunisiaTurkeyTurkmenistanUgandaUkraineUnited Arab EmiratesUnited KingdomUnited StatesUruguayUzbekistanVanuatuVenezuela, RBVietnamWest Bank and GazaYemen, Rep.ZambiaZimbabwe Timeline:
This timeline shows a graph from 1991 to 2016 of Macedonia, FYR. No data until 1990. Number of actual observations by date: 26.
Source name:
World Development Indicators
Source organization:
World Bank national accounts data, and OECD National Accounts data files.
Categories, topics:
Economy & Growth
Last updated:
apr 23, 2017
Indicators value changes by year
Minimum:
43.687 mln
jan 1, 1991
Maximum:
87.304 bln
jan 1, 2016
At the date of observation
Value
Absolute change
Change from previous value
jan 1, 1991
43.687 mln
+43.687 mln
0.0%
jan 1, 1992
135.355 mln
+91.668 mln
209.83%
jan 1, 1993
1.943 bln
+1.808 bln
1.34K%
jan 1, 1994
4.762 bln
+2.819 bln
145.05%
jan 1, 1995
7.687 bln
+2.925 bln
61.42%
jan 1, 1996
18.649 bln
+10.962 bln
142.6%
jan 1, 1997
17.206 bln
-1.443 bln
-7.74%
jan 1, 1998
13.832 bln
-3.374 bln
-19.61%
jan 1, 1999
14.397 bln
+565.157 mln
4.09%
jan 1, 2000
20.308 bln
+5.911 bln
41.05%
jan 1, 2001
18.931 bln
-1.377 bln
-6.78%
jan 1, 2002
10.788 bln
-8.143 bln
-43.01%
jan 1, 2003
4.91 bln
-5.878 bln
-54.49%
jan 1, 2004
5.838 bln
+928.0 mln
18.9%
jan 1, 2005
4.447 bln
-1.391 bln
-23.83%
jan 1, 2006
11.164 bln
+6.717 bln
151.05%
jan 1, 2007
14.865 bln
+3.701 bln
33.15%
jan 1, 2008
21.825 bln
+6.96 bln
46.82%
jan 1, 2009
11.665 bln
-10.16 bln
-46.55%
jan 1, 2010
17.317 bln
+5.652 bln
48.45%
jan 1, 2011
26.967 bln
+9.65 bln
55.73%
jan 1, 2012
36.994 bln
+10.027 bln
37.18%
jan 1, 2013
34.82 bln
-2.174 bln
-5.88%
jan 1, 2014
53.921 bln
+19.101 bln
54.86%
jan 1, 2015
69.248 bln
+15.327 bln
28.42%
jan 1, 2016
87.304 bln
+18.056 bln
26.07%
Ranking of countries by current statistics by years


Comments: