30
/
AIzaSyAYiBZKx7MnpbEhh9jyipgxe19OcubqV5w
April 1, 2024
196053
Mexico
MEX
true
2
1
PNG, bonds (TDS, current US$)
2016,2015,2014,2013,2012,2011,2010,2009,2008,2007,2006,2005,2004,2003,2002,2001,2000,1999,1998,1997,1996,1995,1994,1993,1992
Public Timelines
FAQ
Menu
Public Timelines
FAQ
Public Timelines
FAQ
For education
For educational institutions
For teachers
For students
Open cabinet
For educational institutions
For teachers
For students
Open cabinet
Create
Close
Create a timeline
Public timelines
Library
FAQ
Download
Global statistics library
→
Mexico
→
PNG, bonds (TDS, current US$)
This statistics in other country:
Argentina
Botswana
Brazil
Bulgaria
China
Colombia
Costa Rica
Dominican Republic
East Asia & Pacific (excluding high income)
Ecuador
Egypt, Arab Rep.
El Salvador
Europe & Central Asia (excluding high income)
Georgia
Ghana
Guatemala
IDA only
India
Indonesia
Jamaica
Kazakhstan
Lao PDR
Latin America & Caribbean (excluding high income)
Lebanon
Low & middle income
Lower middle income
Malaysia
Mexico
Middle East & North Africa (excluding high income)
Middle income
Mongolia
Nigeria
Pakistan
Panama
Paraguay
Peru
Philippines
Romania
Russian Federation
Serbia
South Africa
South Asia
Sri Lanka
Sub-Saharan Africa (excluding high income)
Thailand
Turkey
Ukraine
Upper middle income
Venezuela, RB
Vietnam
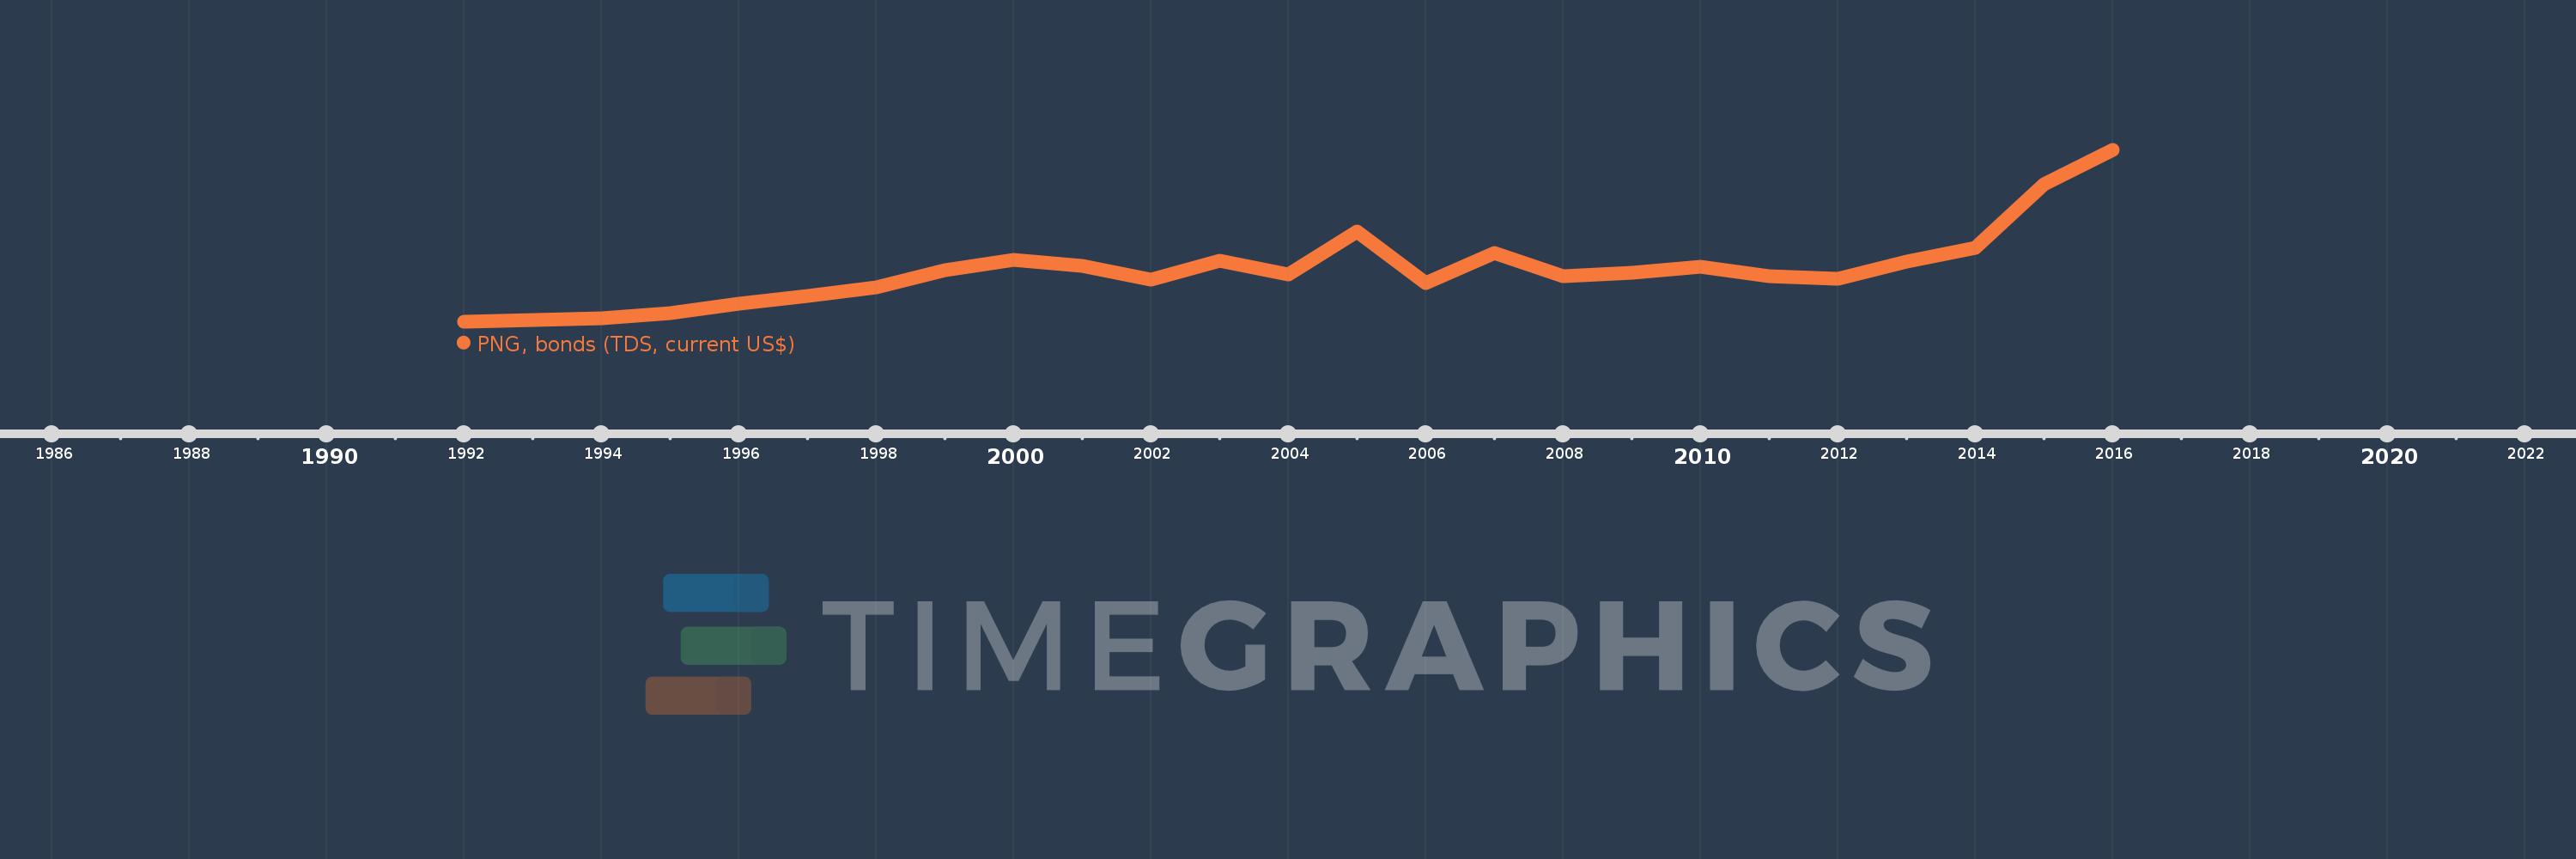
Timeline:
This timeline shows a graph from
1992
to
2016
of Mexico. No data until
1991
. Number of actual observations by date:
25
.
Source name:
World Development Indicators
Source organization:
World Bank, International Debt Statistics.
Categories, topics:
External Debt
Last updated:
apr 23, 2017
Indicators value changes by year
Meaning:
4.775 bln
Minimum:
27.912 mln
jan 1, 1992
Maximum:
15.744 bln
jan 1, 2016
At the date of observation
Value
Absolute change
Change from the previous value
jan 1, 1992
27.912 mln
+27.912 mln
0.0%
jan 1, 1993
214.128 mln
+186.216 mln
667.15%
jan 1, 1994
378.158 mln
+164.03 mln
76.6%
jan 1, 1995
875.569 mln
+497.411 mln
131.54%
jan 1, 1996
1.664 bln
+788.287 mln
90.03%
jan 1, 1997
2.424 bln
+760.065 mln
45.68%
jan 1, 1998
3.201 bln
+776.922 mln
32.05%
jan 1, 1999
4.784 bln
+1.584 bln
49.47%
jan 1, 2000
5.725 bln
+940.72 mln
19.66%
jan 1, 2001
5.172 bln
-553.195 mln
-9.66%
jan 1, 2002
3.9 bln
-1.272 bln
-24.59%
jan 1, 2003
5.622 bln
+1.721 bln
44.13%
jan 1, 2004
4.348 bln
-1.274 bln
-22.66%
jan 1, 2005
8.34 bln
+3.992 bln
91.82%
jan 1, 2006
3.602 bln
-4.738 bln
-56.81%
jan 1, 2007
6.324 bln
+2.722 bln
75.58%
jan 1, 2008
4.23 bln
-2.094 bln
-33.12%
jan 1, 2009
4.557 bln
+327.0 mln
7.73%
jan 1, 2010
5.083 bln
+526.0 mln
11.54%
jan 1, 2011
4.205 bln
-878.0 mln
-17.27%
jan 1, 2012
3.977 bln
-228.37 mln
-5.43%
jan 1, 2013
5.572 bln
+1.596 bln
40.13%
jan 1, 2014
6.796 bln
+1.223 bln
21.95%
jan 1, 2015
12.612 bln
+5.816 bln
85.59%
jan 1, 2016
15.744 bln
+3.132 bln
24.83%
Ranking of countries by current statistics by years
About & Feedback
Terms
Privacy
Library
2024
©
Time.Graphics
Support 24/7
Cabinet
Get premium
Donate
The service accepts bank transfer (ACH, Wire) or cards (Visa, MasterCard, etc). Processed by Stripe.
Secured with SSL
Excellent (Trustpilot Reviews)
Based on 115+ reviews
Write your own review on
Trustpilot.com
